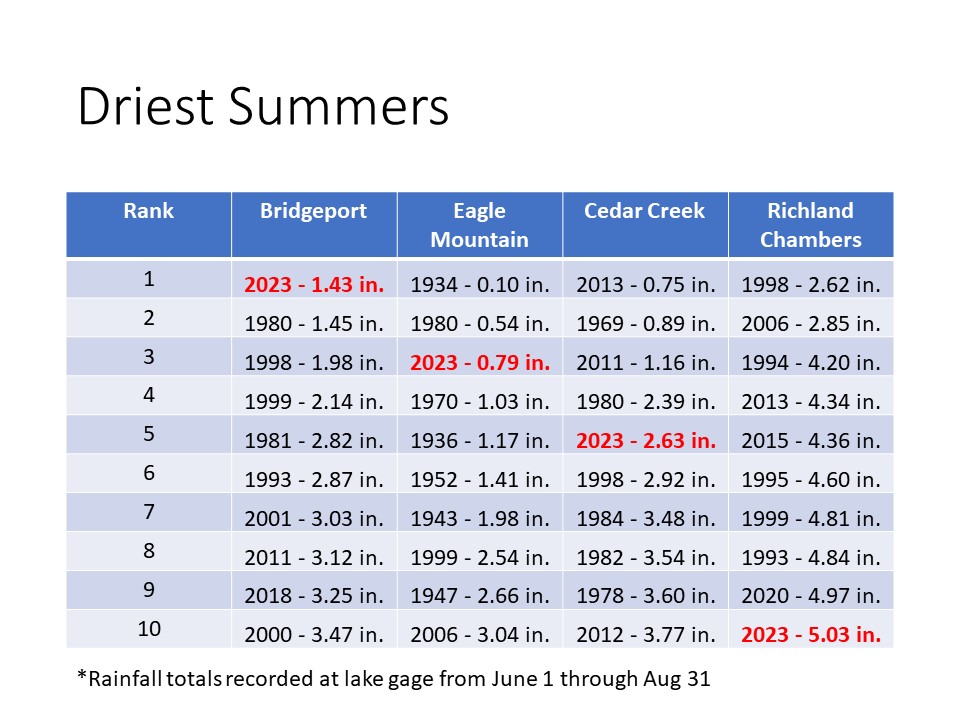
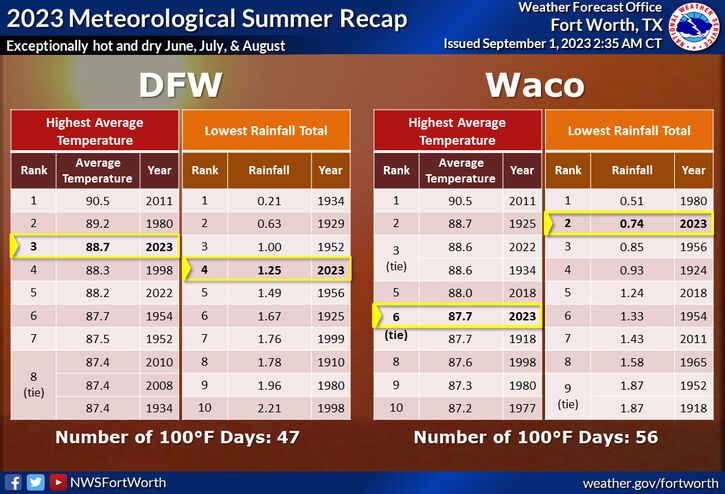
The National Weather Service is reporting this summer was the 4th driest on record at D/FW Airport. Let’s have a look at rainfall totals at the TRWD Lakes. Below are the Top 10 Driest Summers at the TRWD lakes. Driest is measured as precipitation recorded by the rain gage located at the lake from June 1st through August 31st.
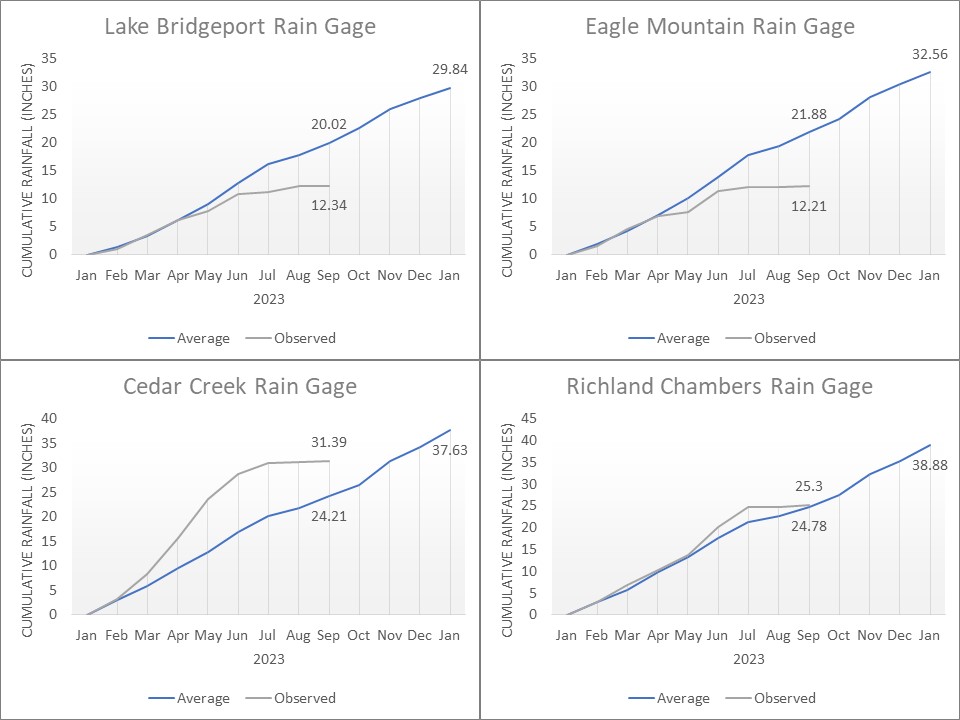
The plots below show year-to-date rainfall totals at the lakes compared to a normal year. As you can see Bridgeport and Eagle Mountain are well below normal, leading to low lake levels. Cedar Creek and Richland-Chambers are above normal, thanks to a very wet spring that filled both reservoirs prior to the summer dry spell.
Did you know???
TRWD partners with the United States Geological Survey (USGS) on over 30 gage sites in the Trinity River Watershed, including the sites located at the TRWD lakes that report lake level.
- Bridgeport Res Abv Bridgeport, TX – 08043000
- Eagle Mtn Res Abv Ft Worth, TX – 08045000
- Cedar Ck Res nr Trinidad, TX – 08063010
- Richland-Chambers Res nr Kerens, TX – 08064550
Want to learn more about the watersheds that contribute to the TRWD lakes?
Check out the Watersheds page and sign up for The Tributary, a quarterly newsletter covering all things TRWD watersheds.