Lake Level Blog

More Lake Level Projections

By July 11, 2023

As promised, more lake level projections from the June 21st TRWD system simulation.  As a reminder, these projections represent a range of possible lake level outcomes resulting from the variation in rainfall, evaporation, and water usage experienced at the TRWD lakes.  Please note, projections are subject to change.

The next round of projections will be ready late July.  Please check back or even better, sign up for notifications to TRWD Lake Level Blog.

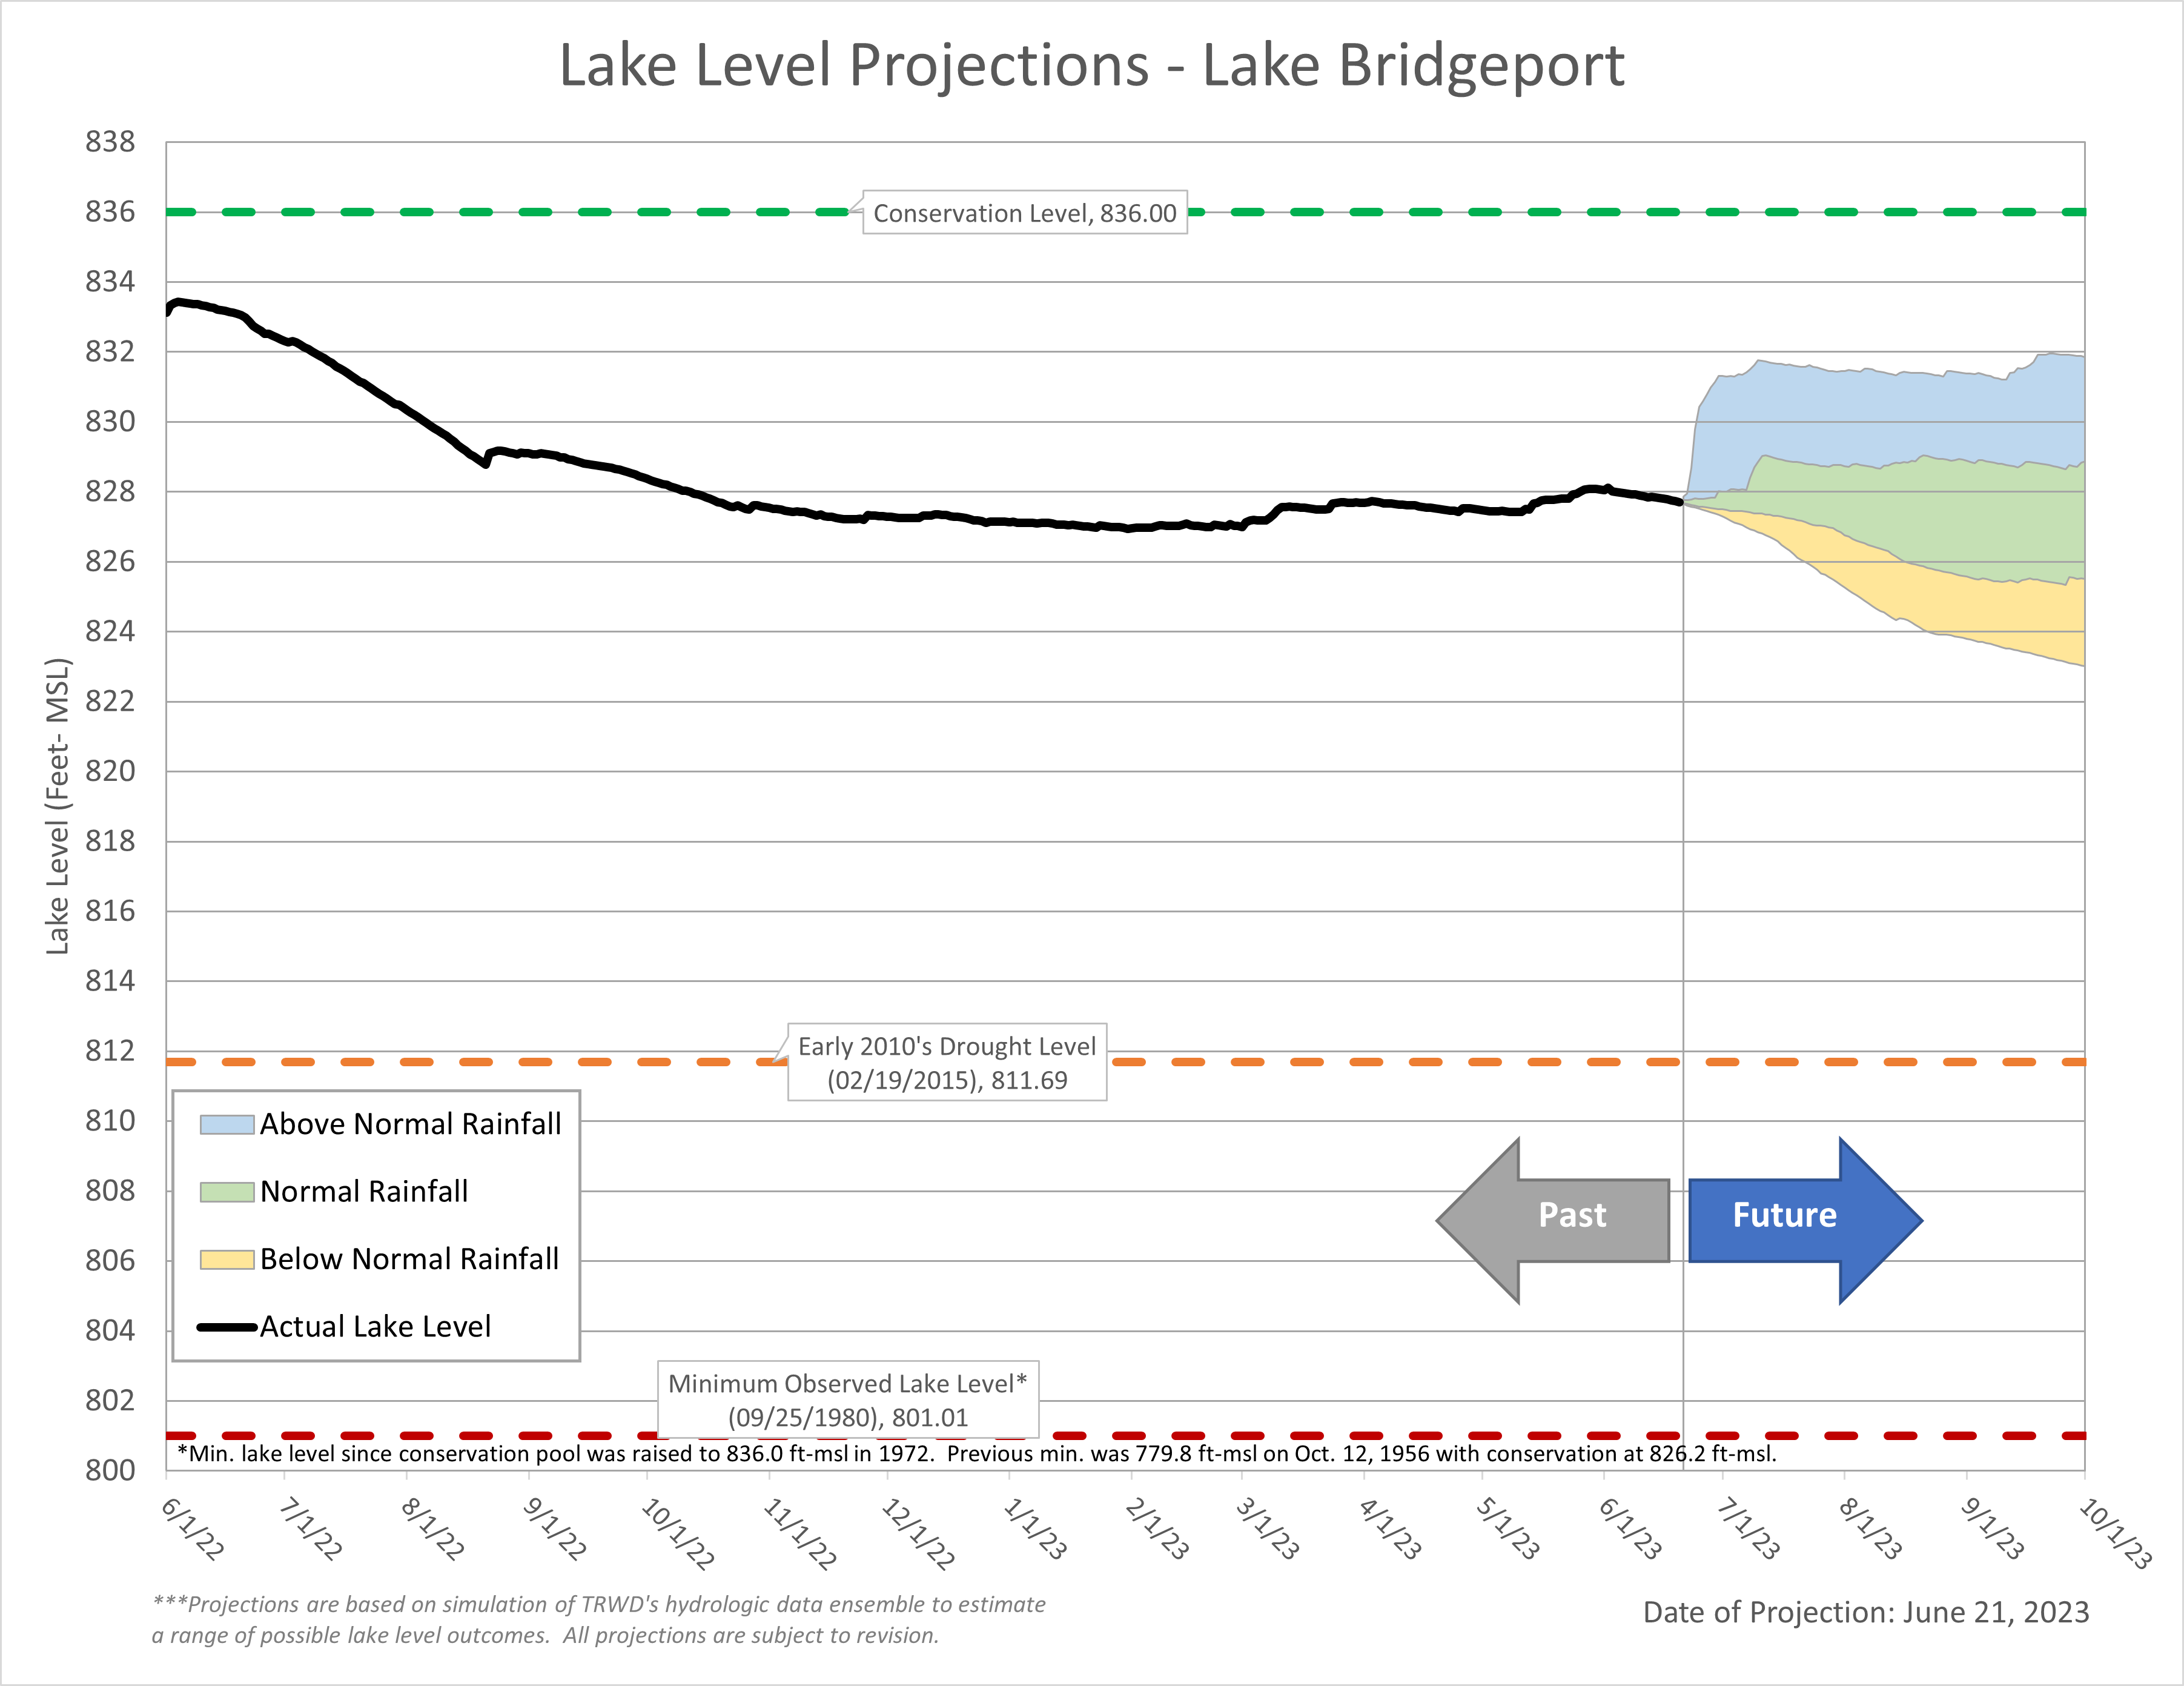
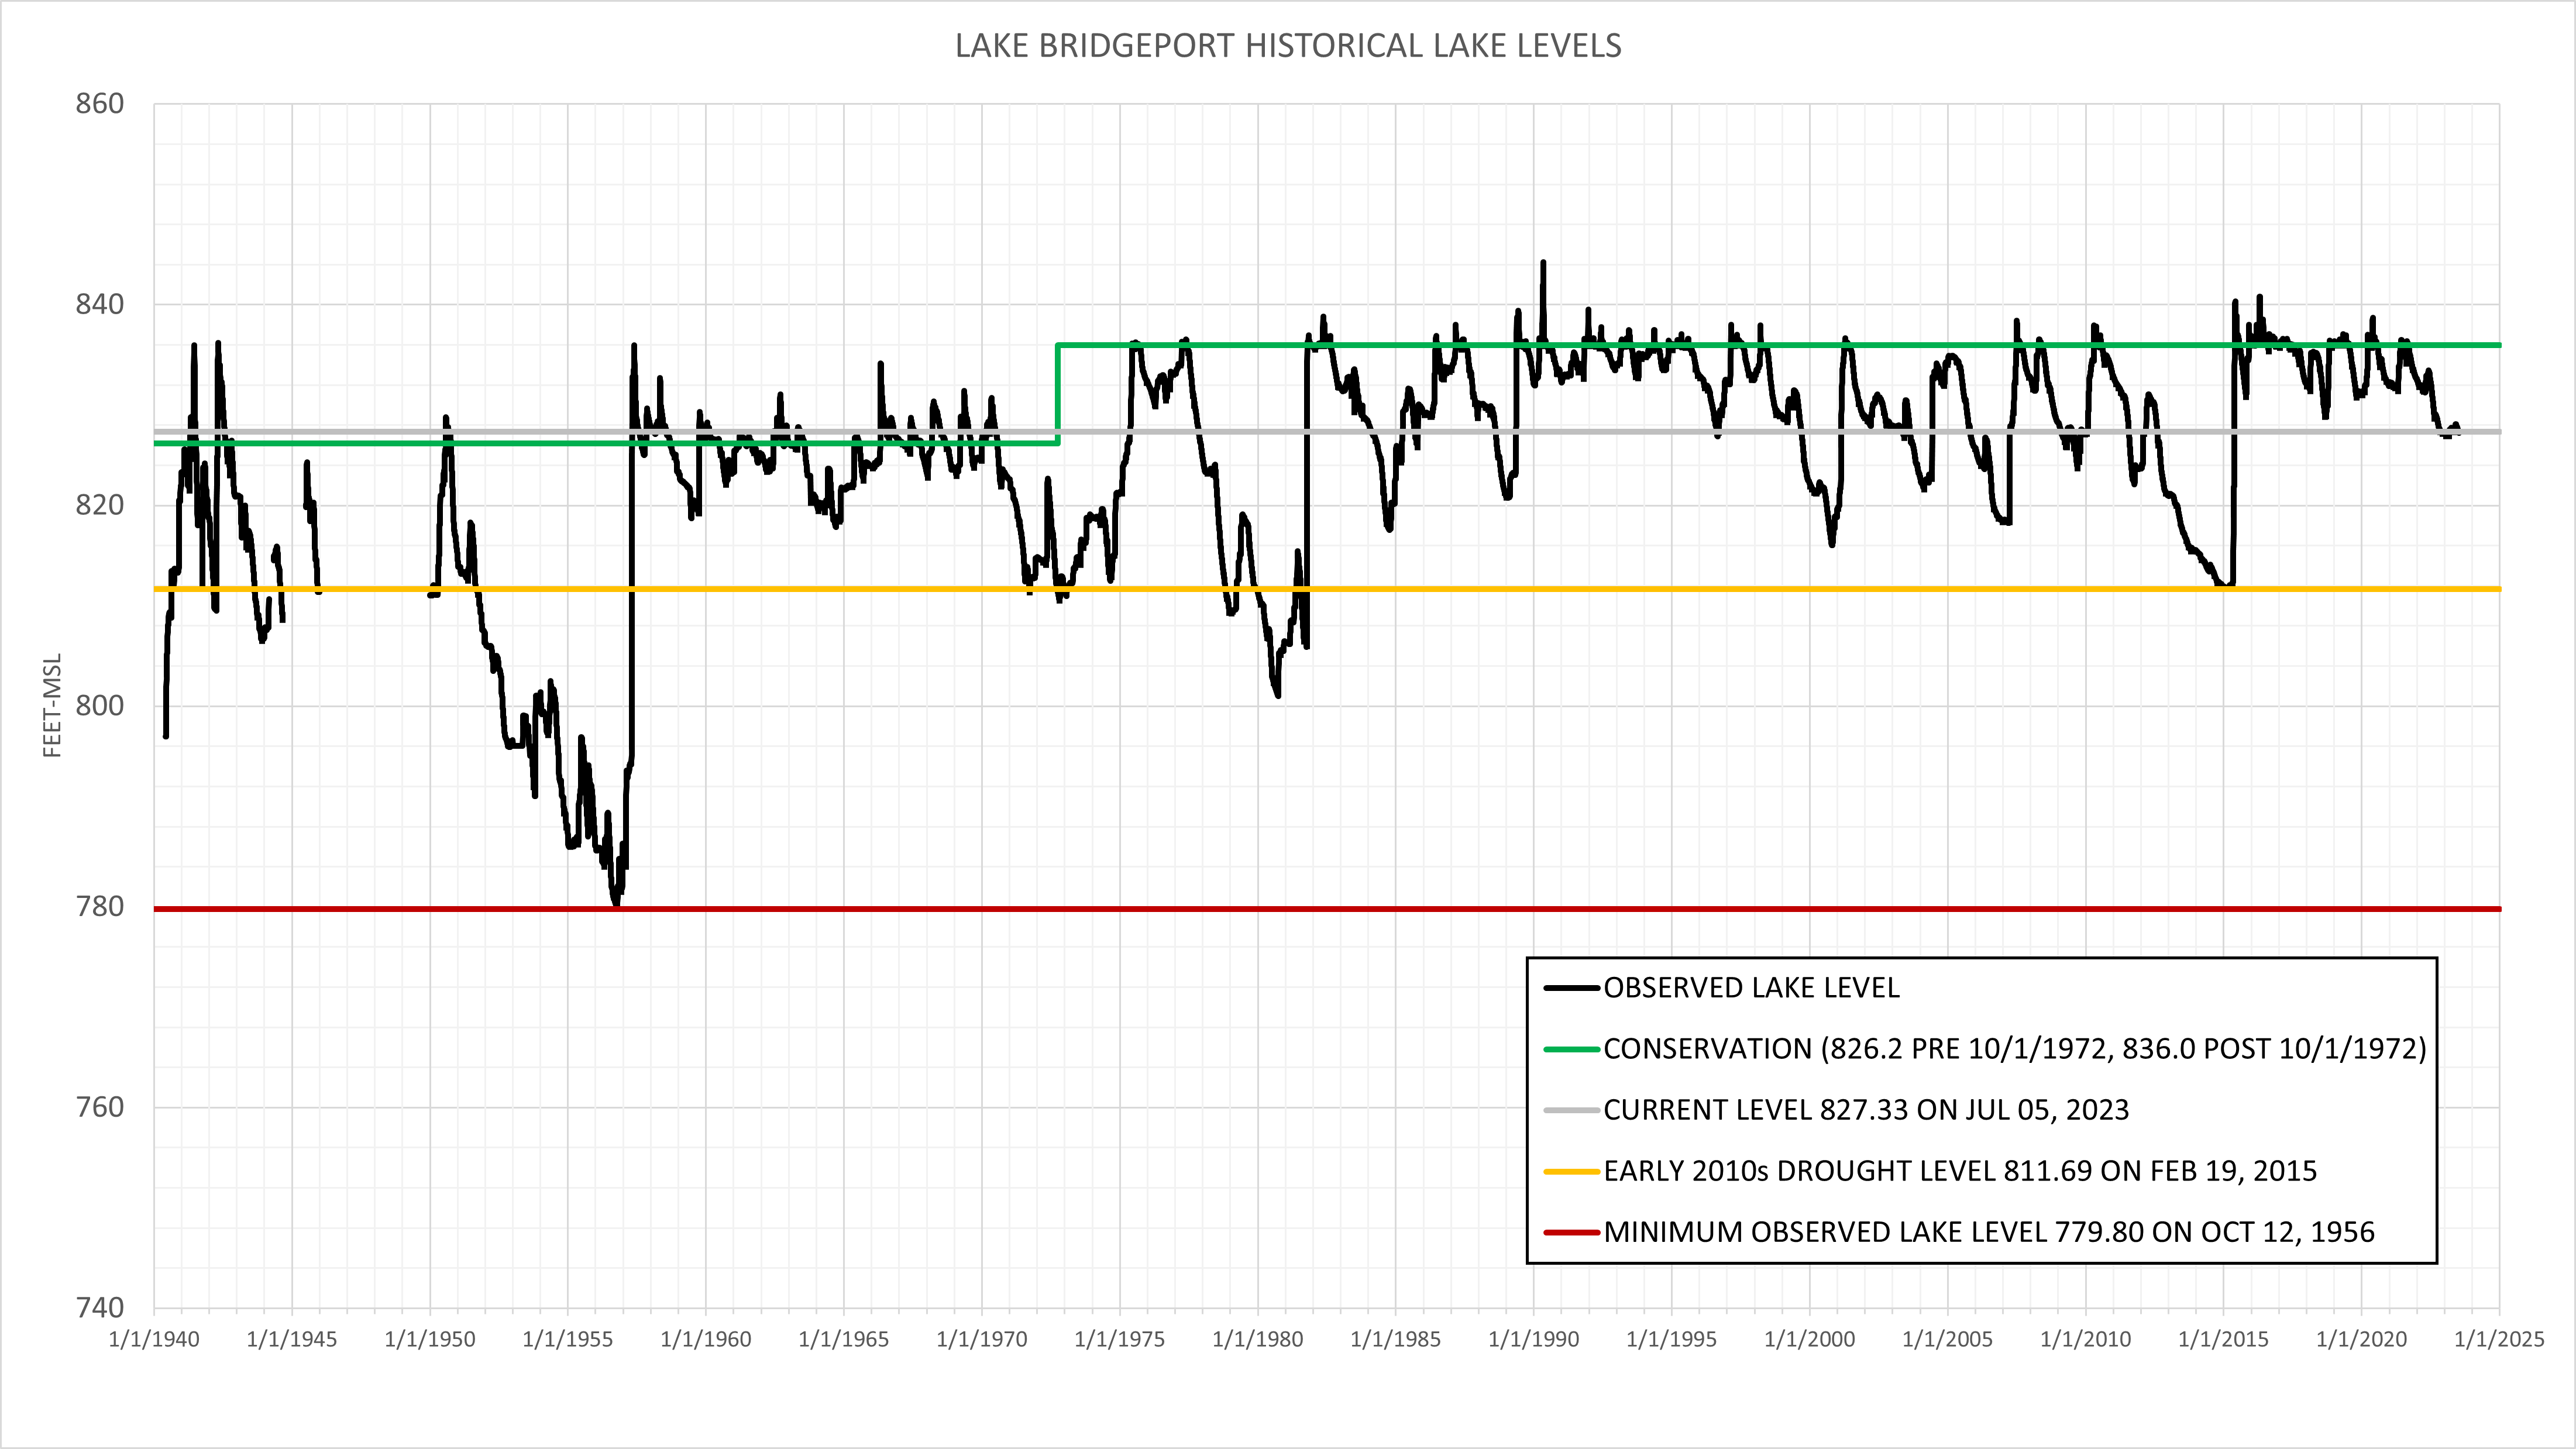
Lake Bridgeport Elevation History


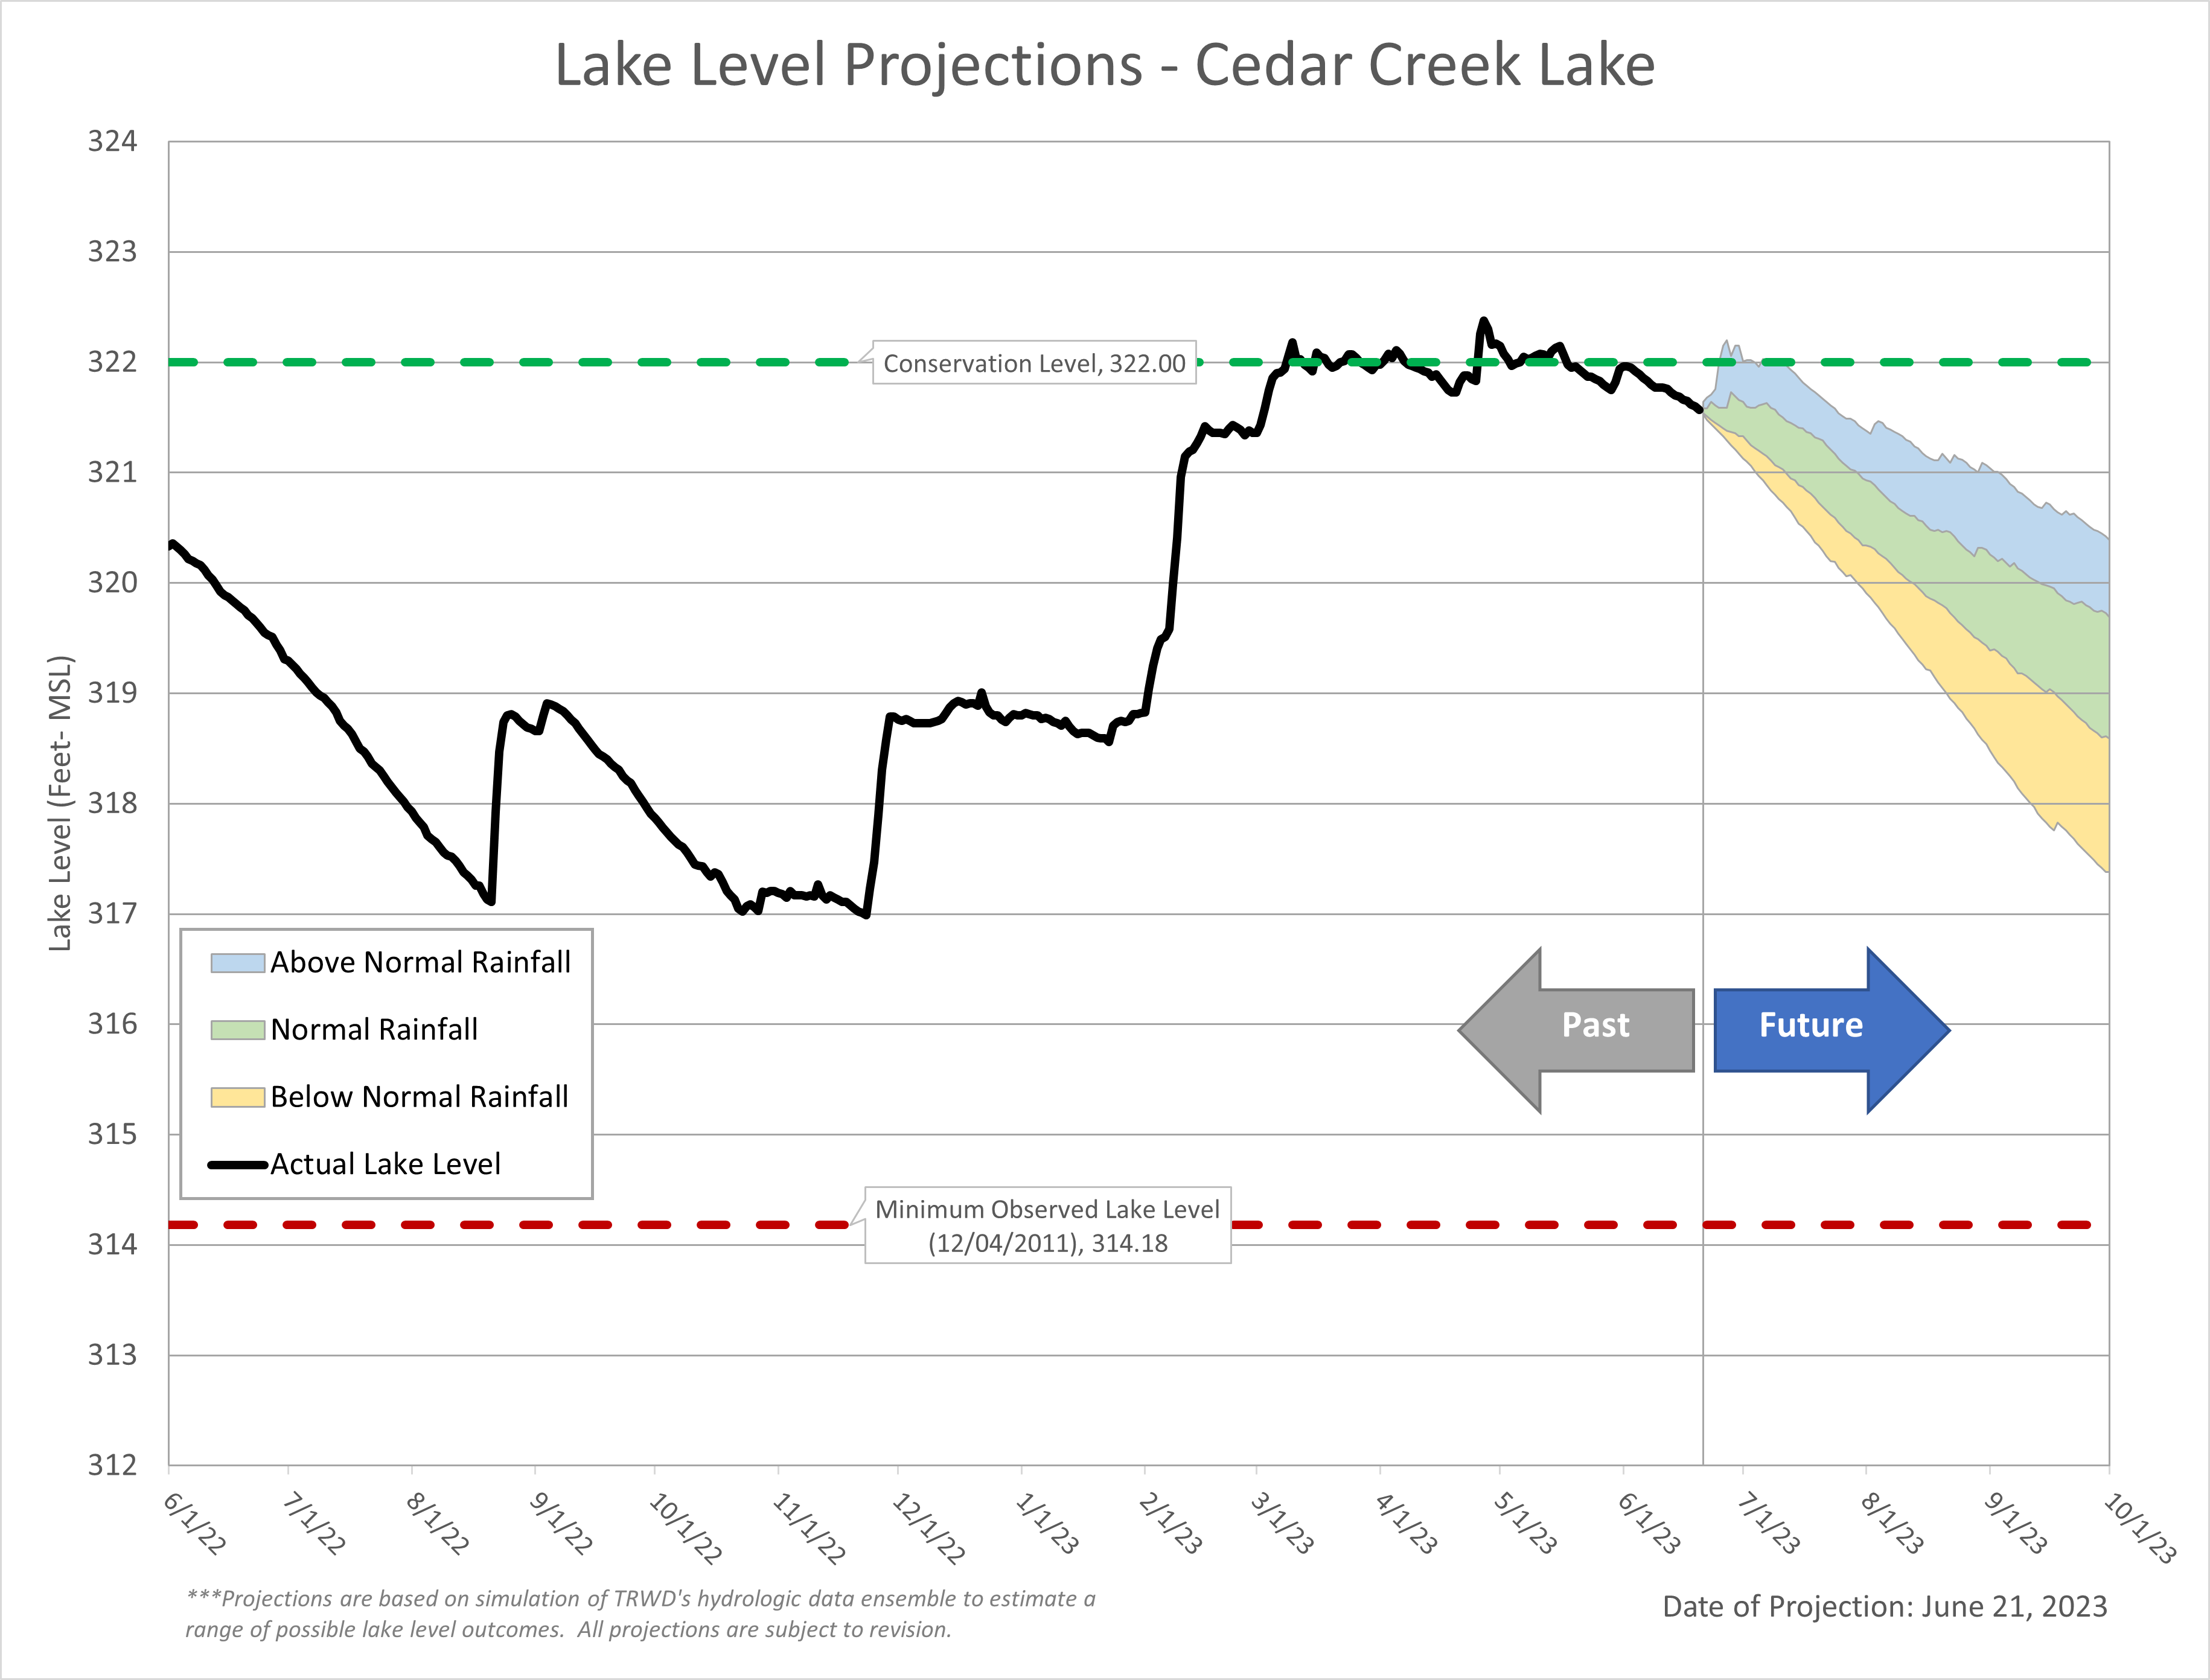
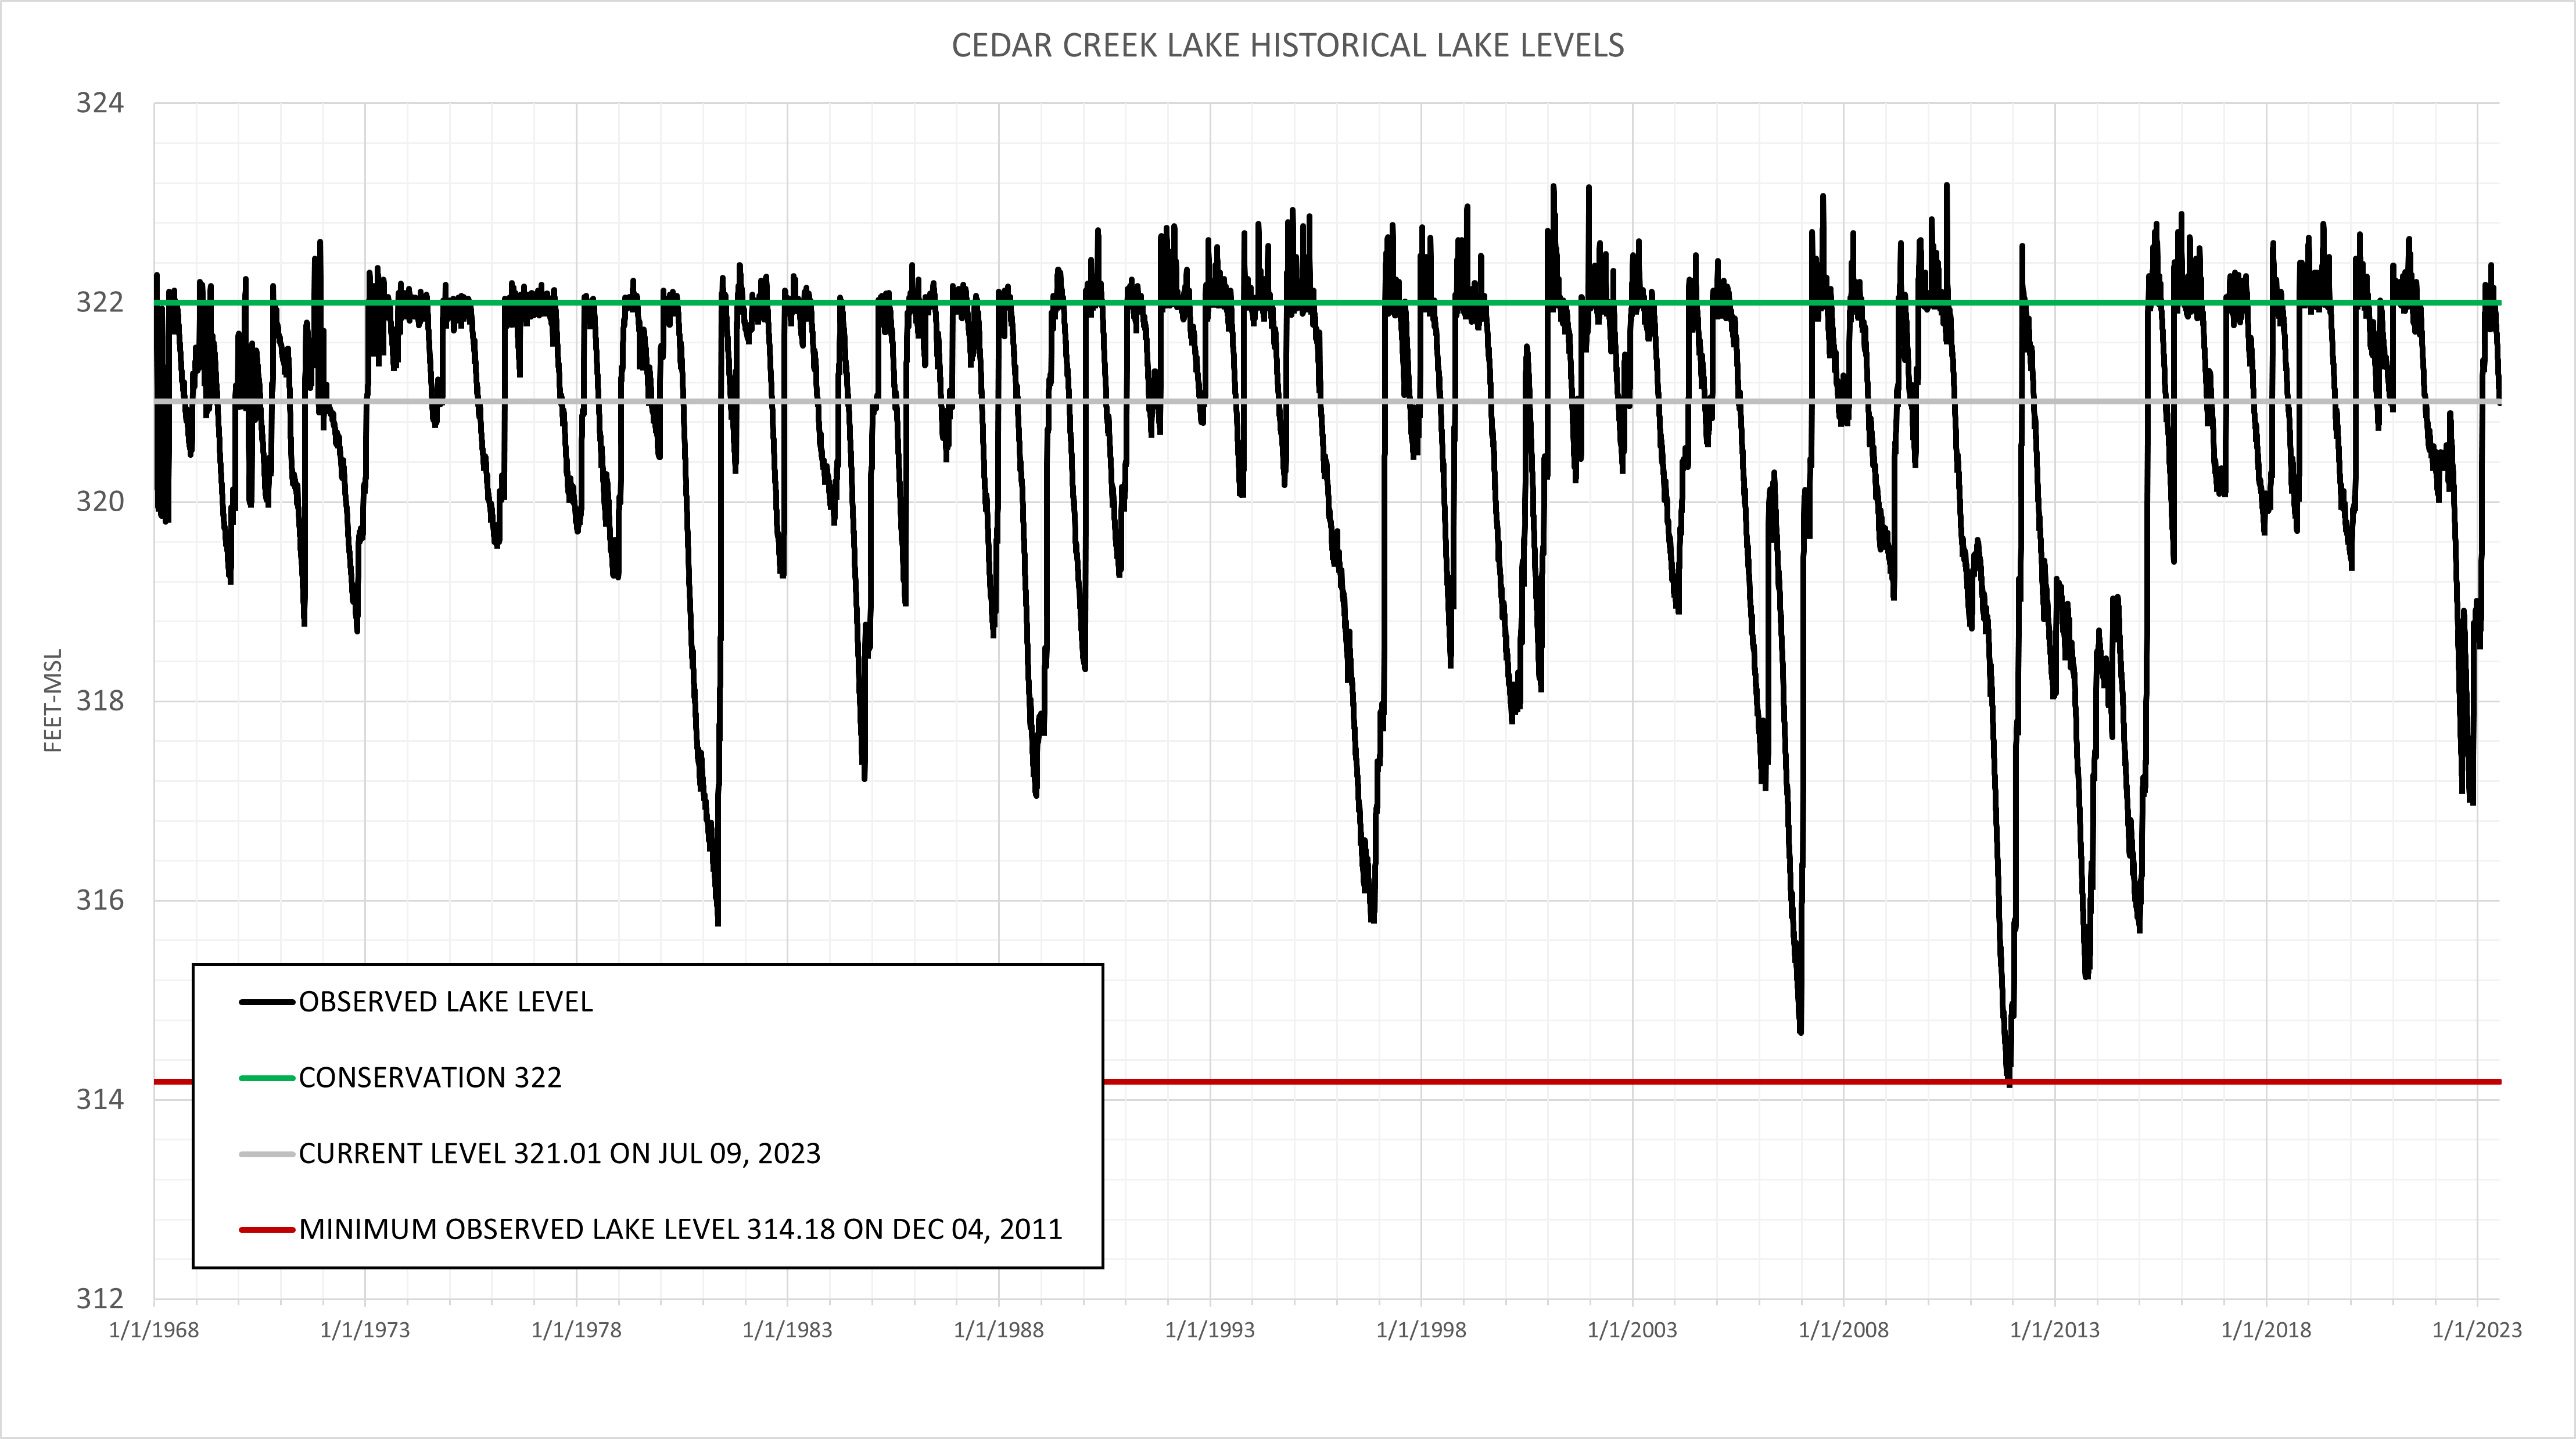
Cedar Creek Lake Elevation History


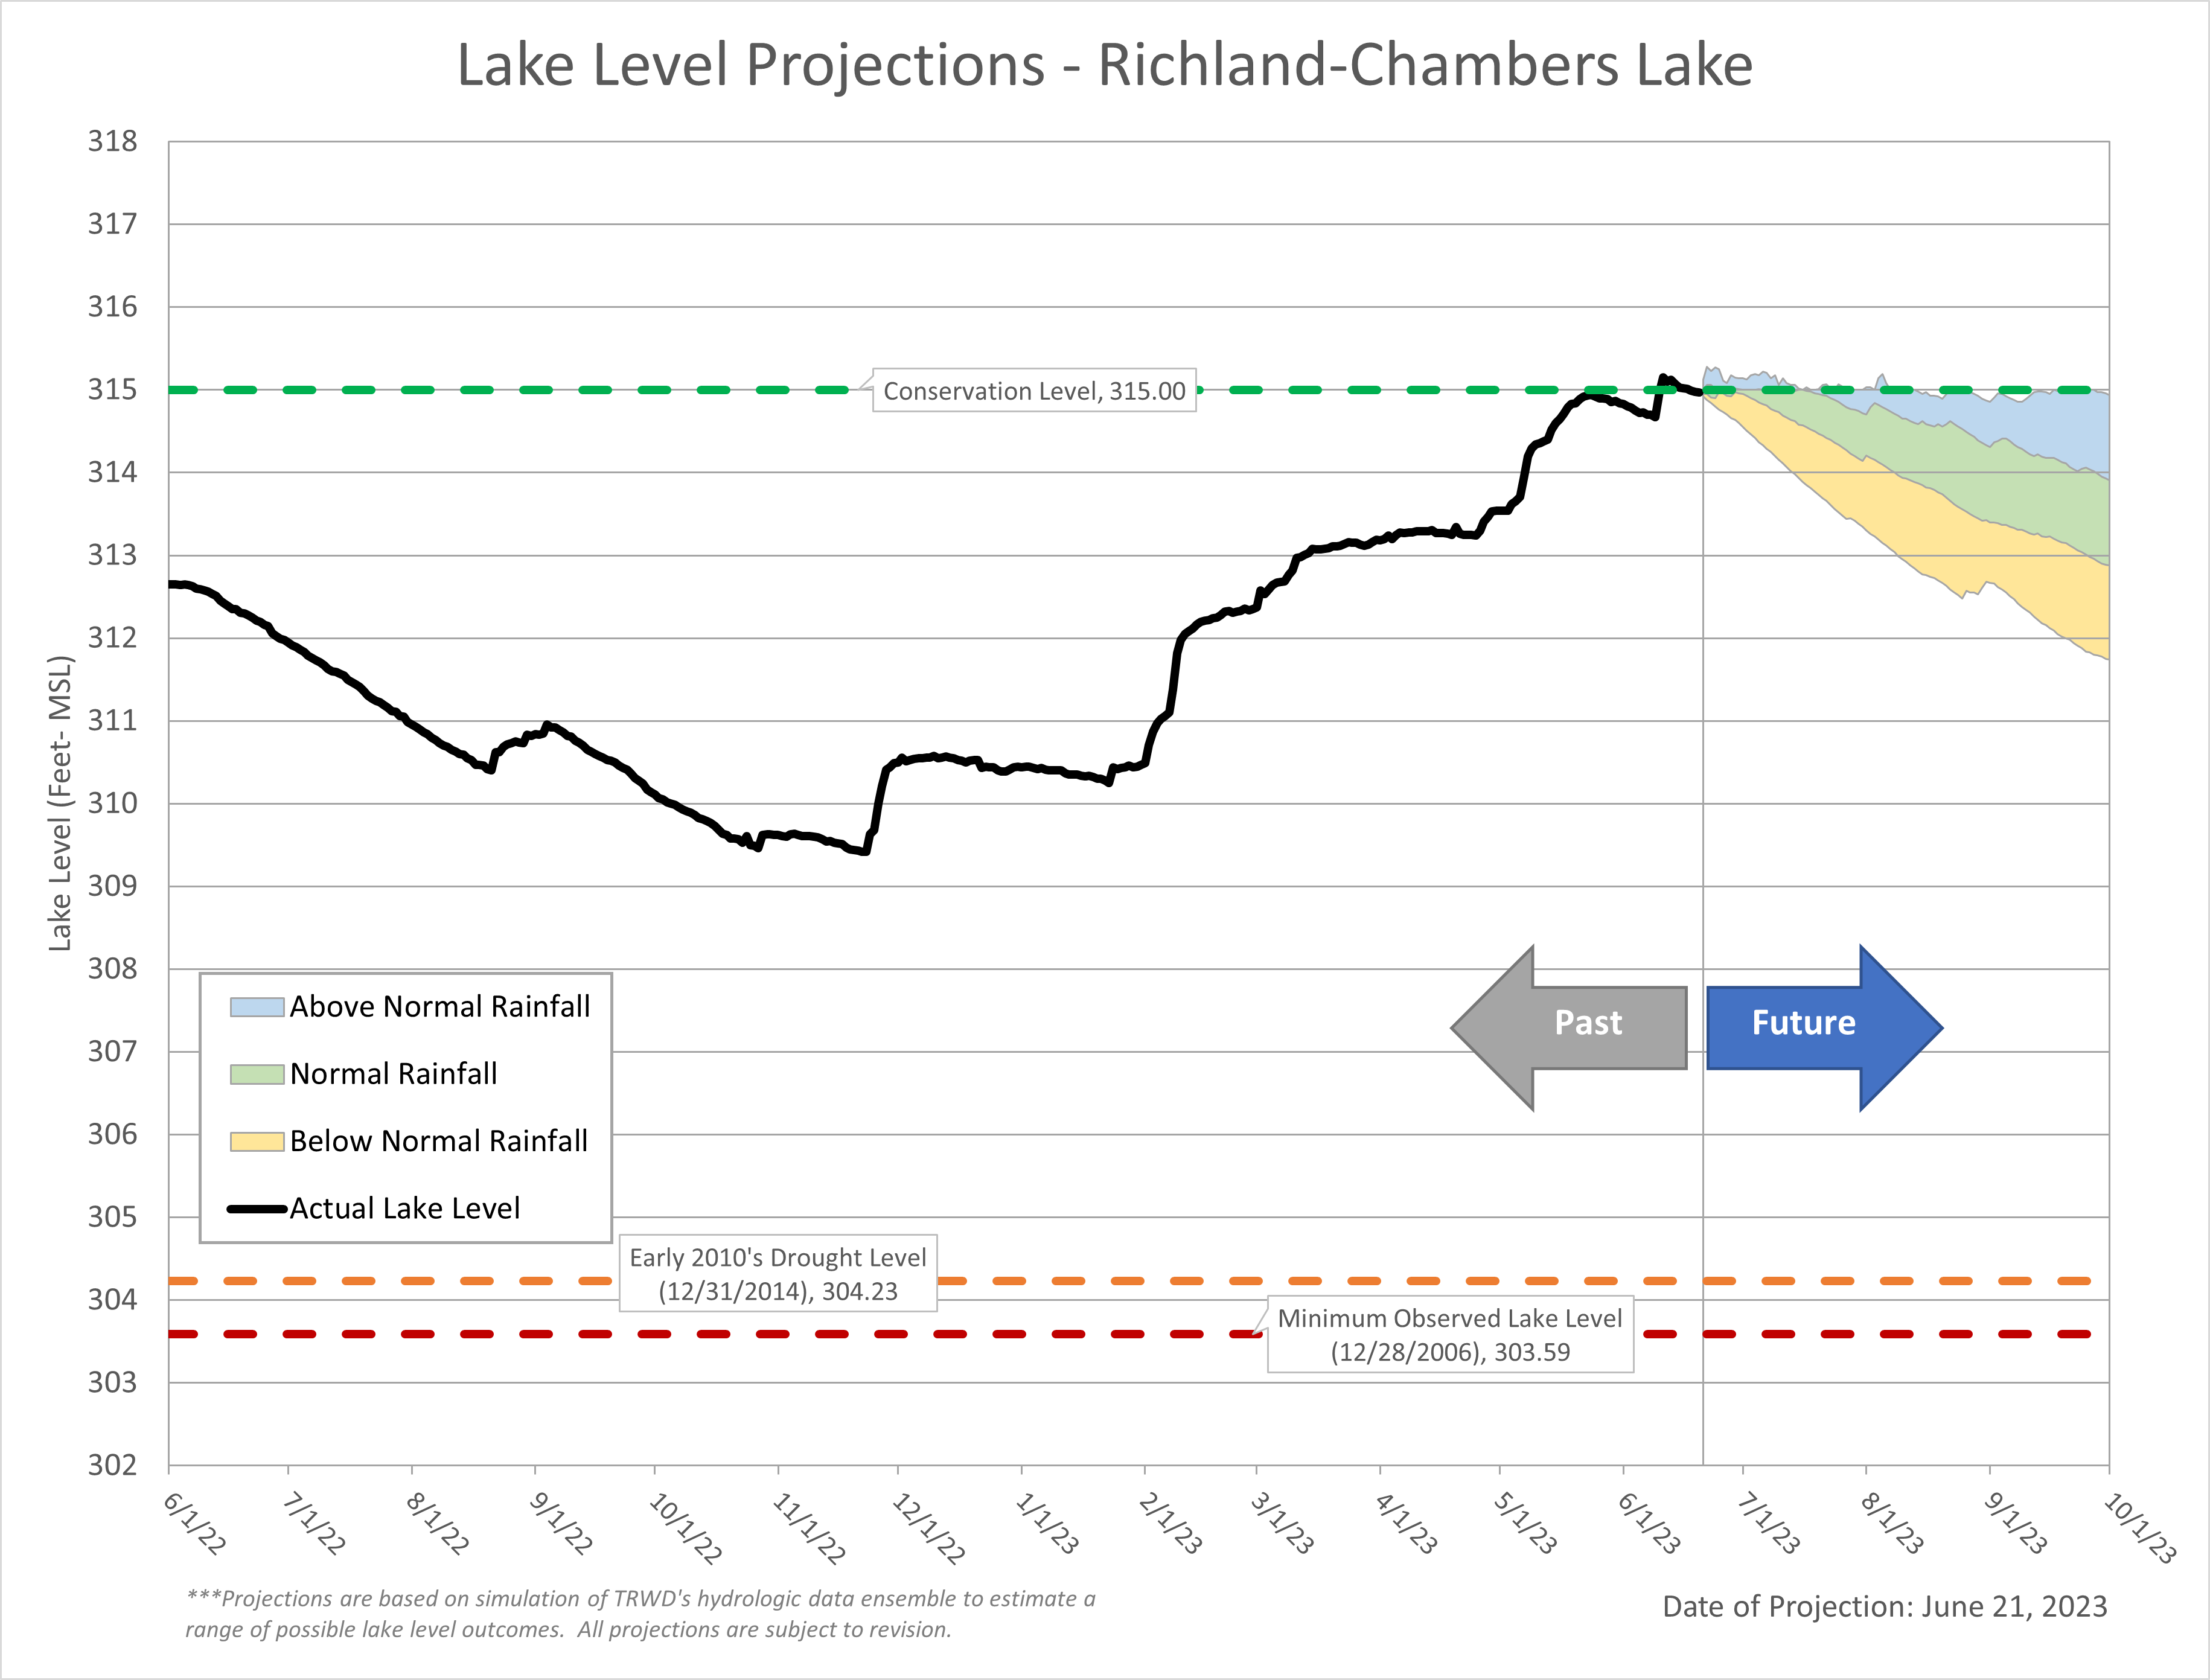
Richland-Chambers Lake Elevation History


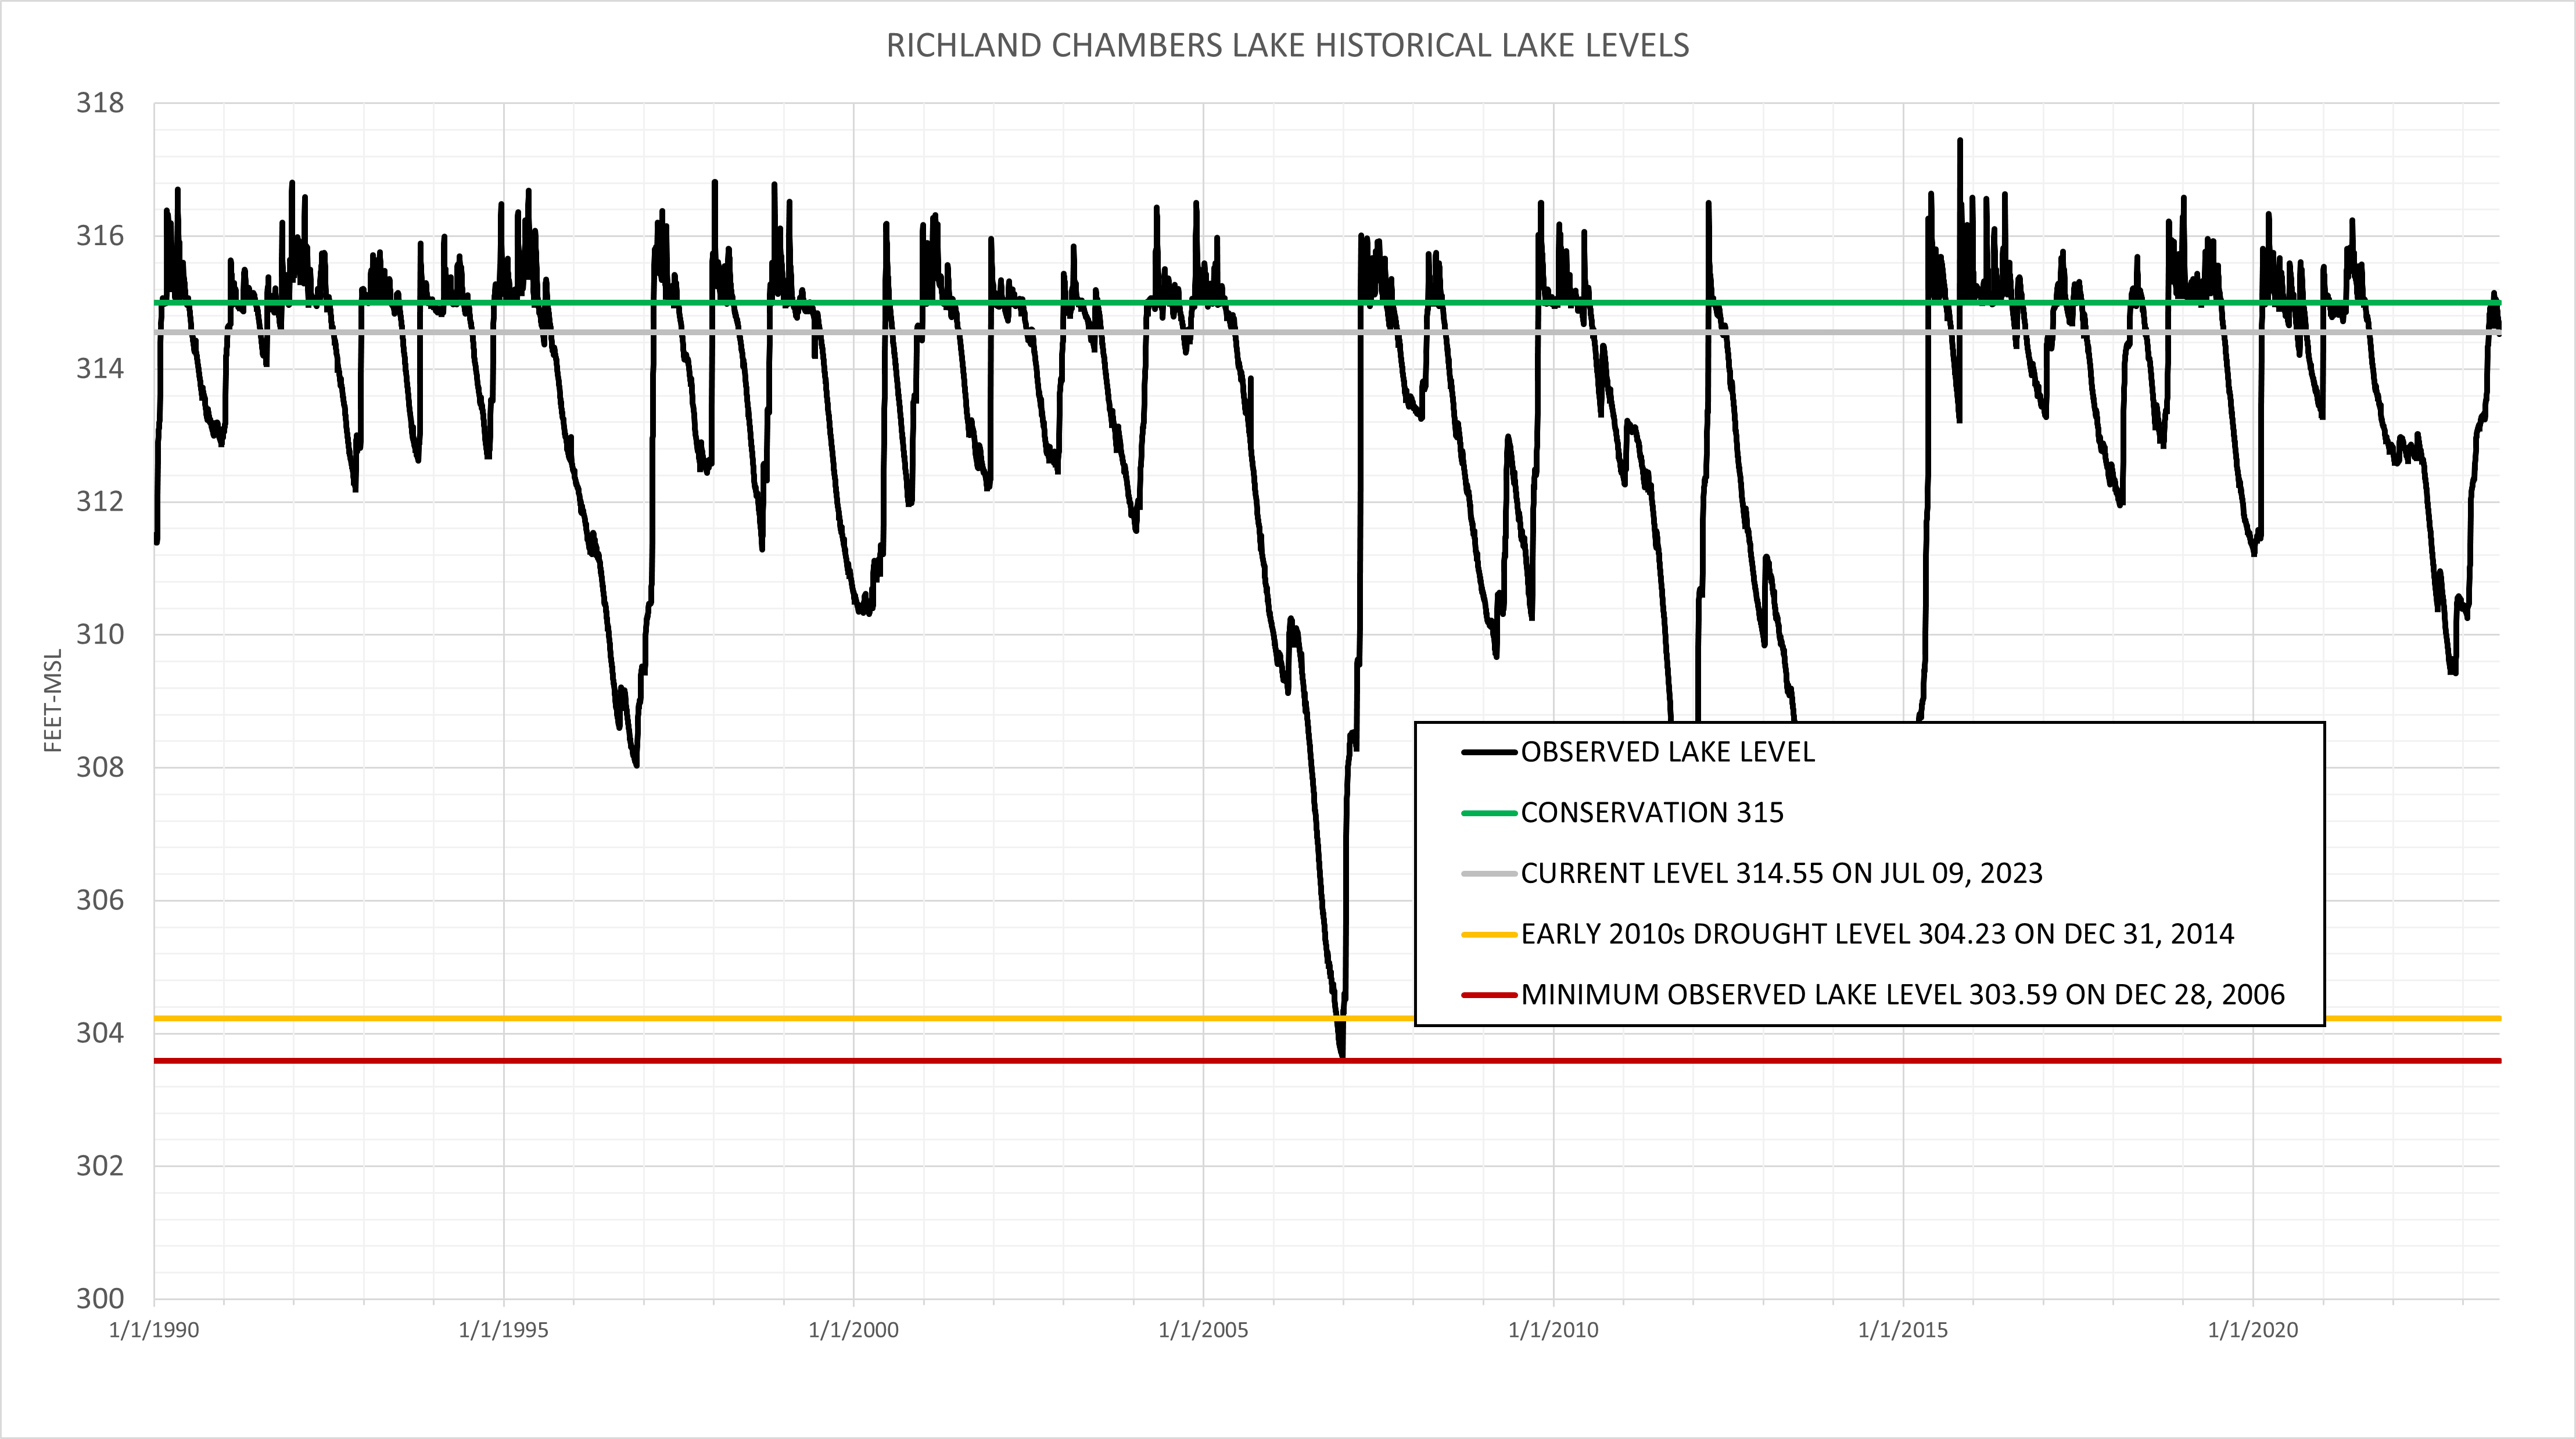
Current lake levels can be found in a variety of locations including TRWD.comtrwd.onerain.com, or download the TRWD Lake Level App for iOS or Android.


Posted by: CO

Lake Current Level Conservation Level* Level Difference**
Arlington 550.97 550.00 0.97
Benbrook 700.22 694.00 6.22
Bridgeport 822.67 836.00 -13.33
Cedar Creek 322.38 322.00 0.38
Eagle Mountain 648.31 649.10 -0.79
Lake Worth 592.14 594.00 -1.86
Richland-Chambers 316.13 315.00 1.13
*Conservation Level: The permitted level of water an entity is allowed to hold in a lake. Any amount above the conservation level is used for the temporary storage of flood waters and must be released downstream.
**Difference: Amount above or below conservation level.
For more information read our daily reports or the TRWD Lake Level Blog.

Check out the TRWD OneRain portal for a visualization of this information and more.

Stay connected with TRWD!

Sign up for our newsletter!

Newsletter Sign Up