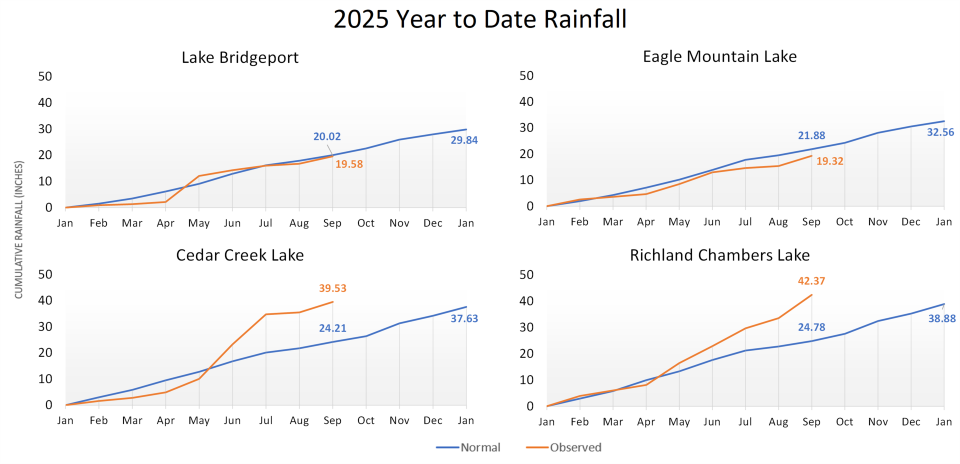
August brought above-average rainfall across the TRWD service area. Typically, the summer months bring a decline in total system storage, but the intermittent rain showers and mild temperatures helped slow the decline. Currently, TRWD system storage is at 96% capacity, which is only a 2% decrease from July. Both the West Fork (Bridgeport and Eagle Mountain) and East Texas (Cedar Creek and Richland-Chambers) systems are above 90%.
Highlights:
- Temperature: August temperatures were mostly within the normal range, with a few days reaching or exceeding the 100-degree mark. A few cold fronts helped keep temperatures from climbing too high.
- Rainfall: August rainfall was above normal across the TRWD service area, with totals exceeding 3 inches above normal in East Texas and 2 inches in the West Fork. See the 30-Day Percent of Normal Rainfall map below.
- Drought Conditions: Most of North Texas is currently free of drought. However, parts of Parker and Tarrant counties are starting to show Abnormally Dry (D0) conditions. See the NWS Drought Monitor.
Looking Ahead:
- September Forecast: Below-normal temperatures and above-normal rainfall are expected for the first half of September.
- Extended Outlook: Currently, ENSO conditions are neutral and expected to persist through the summer, but there’s a chance of a shift toward La Niña in the fall/winter months before reverting to ENSO-neutral. Current projections are leaning towards below-normal precipitation and above-normal temperatures for the next three months.
Stay Informed by Checking Out the Following:
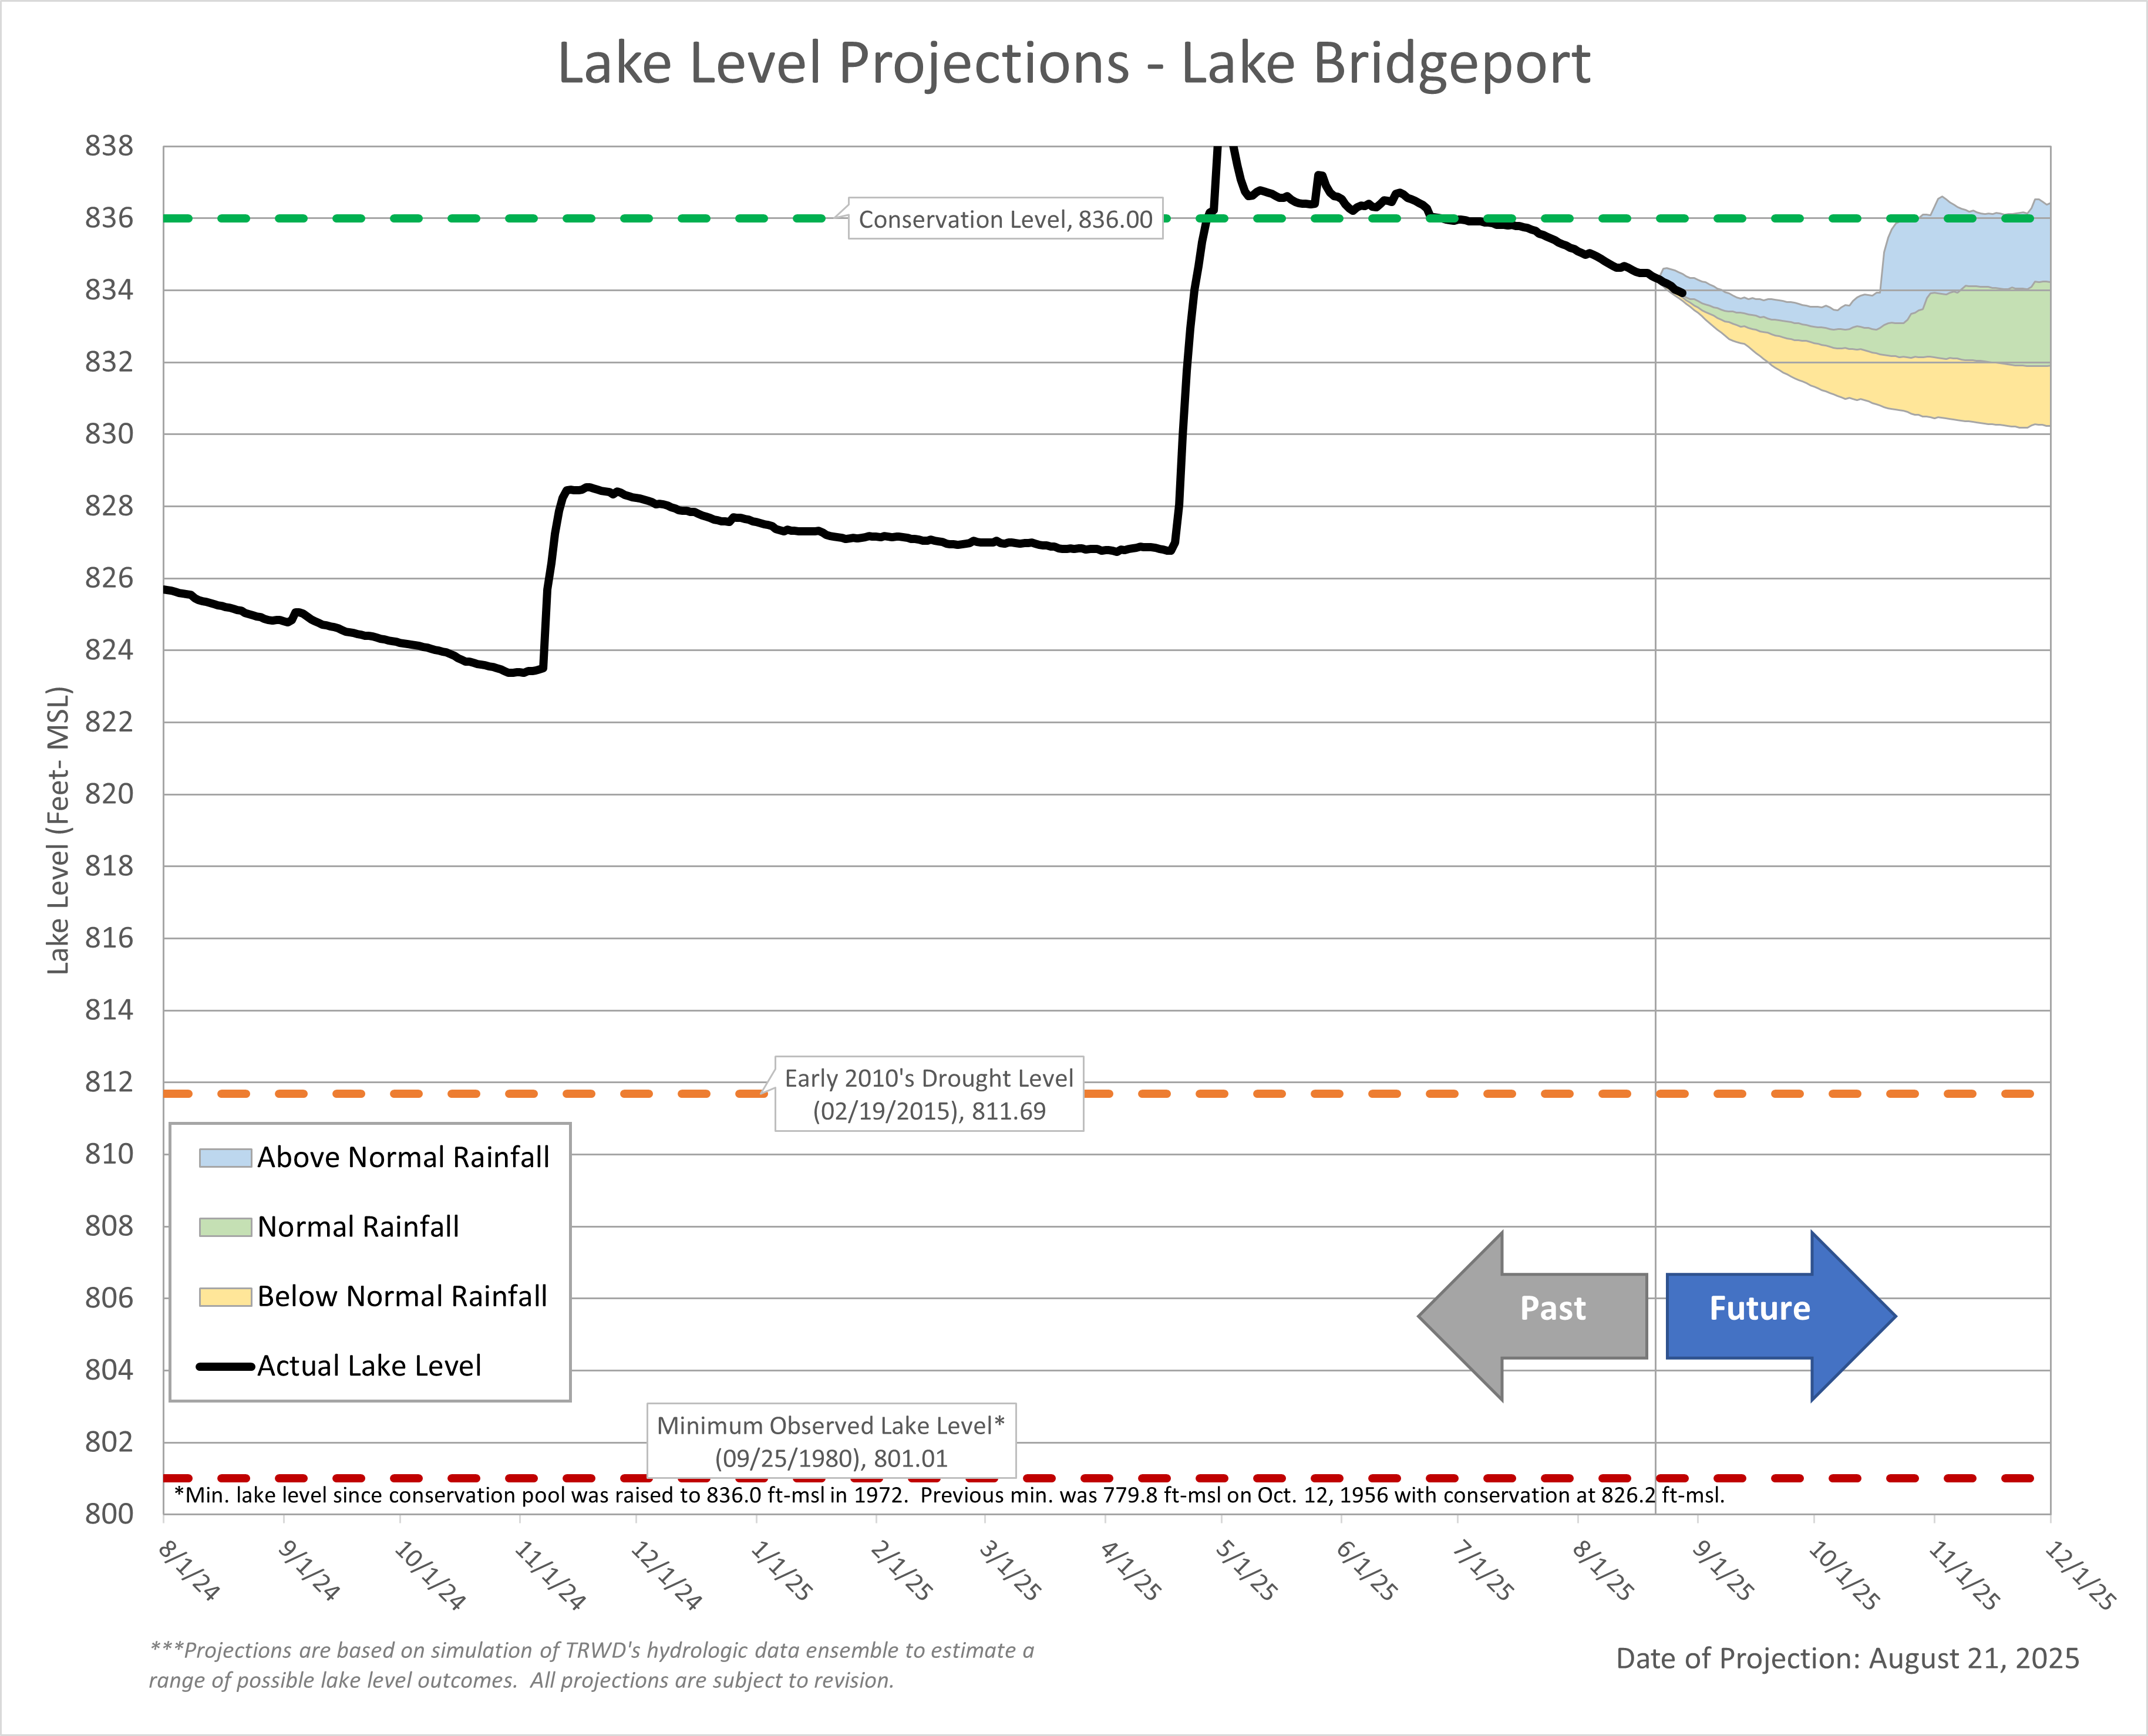
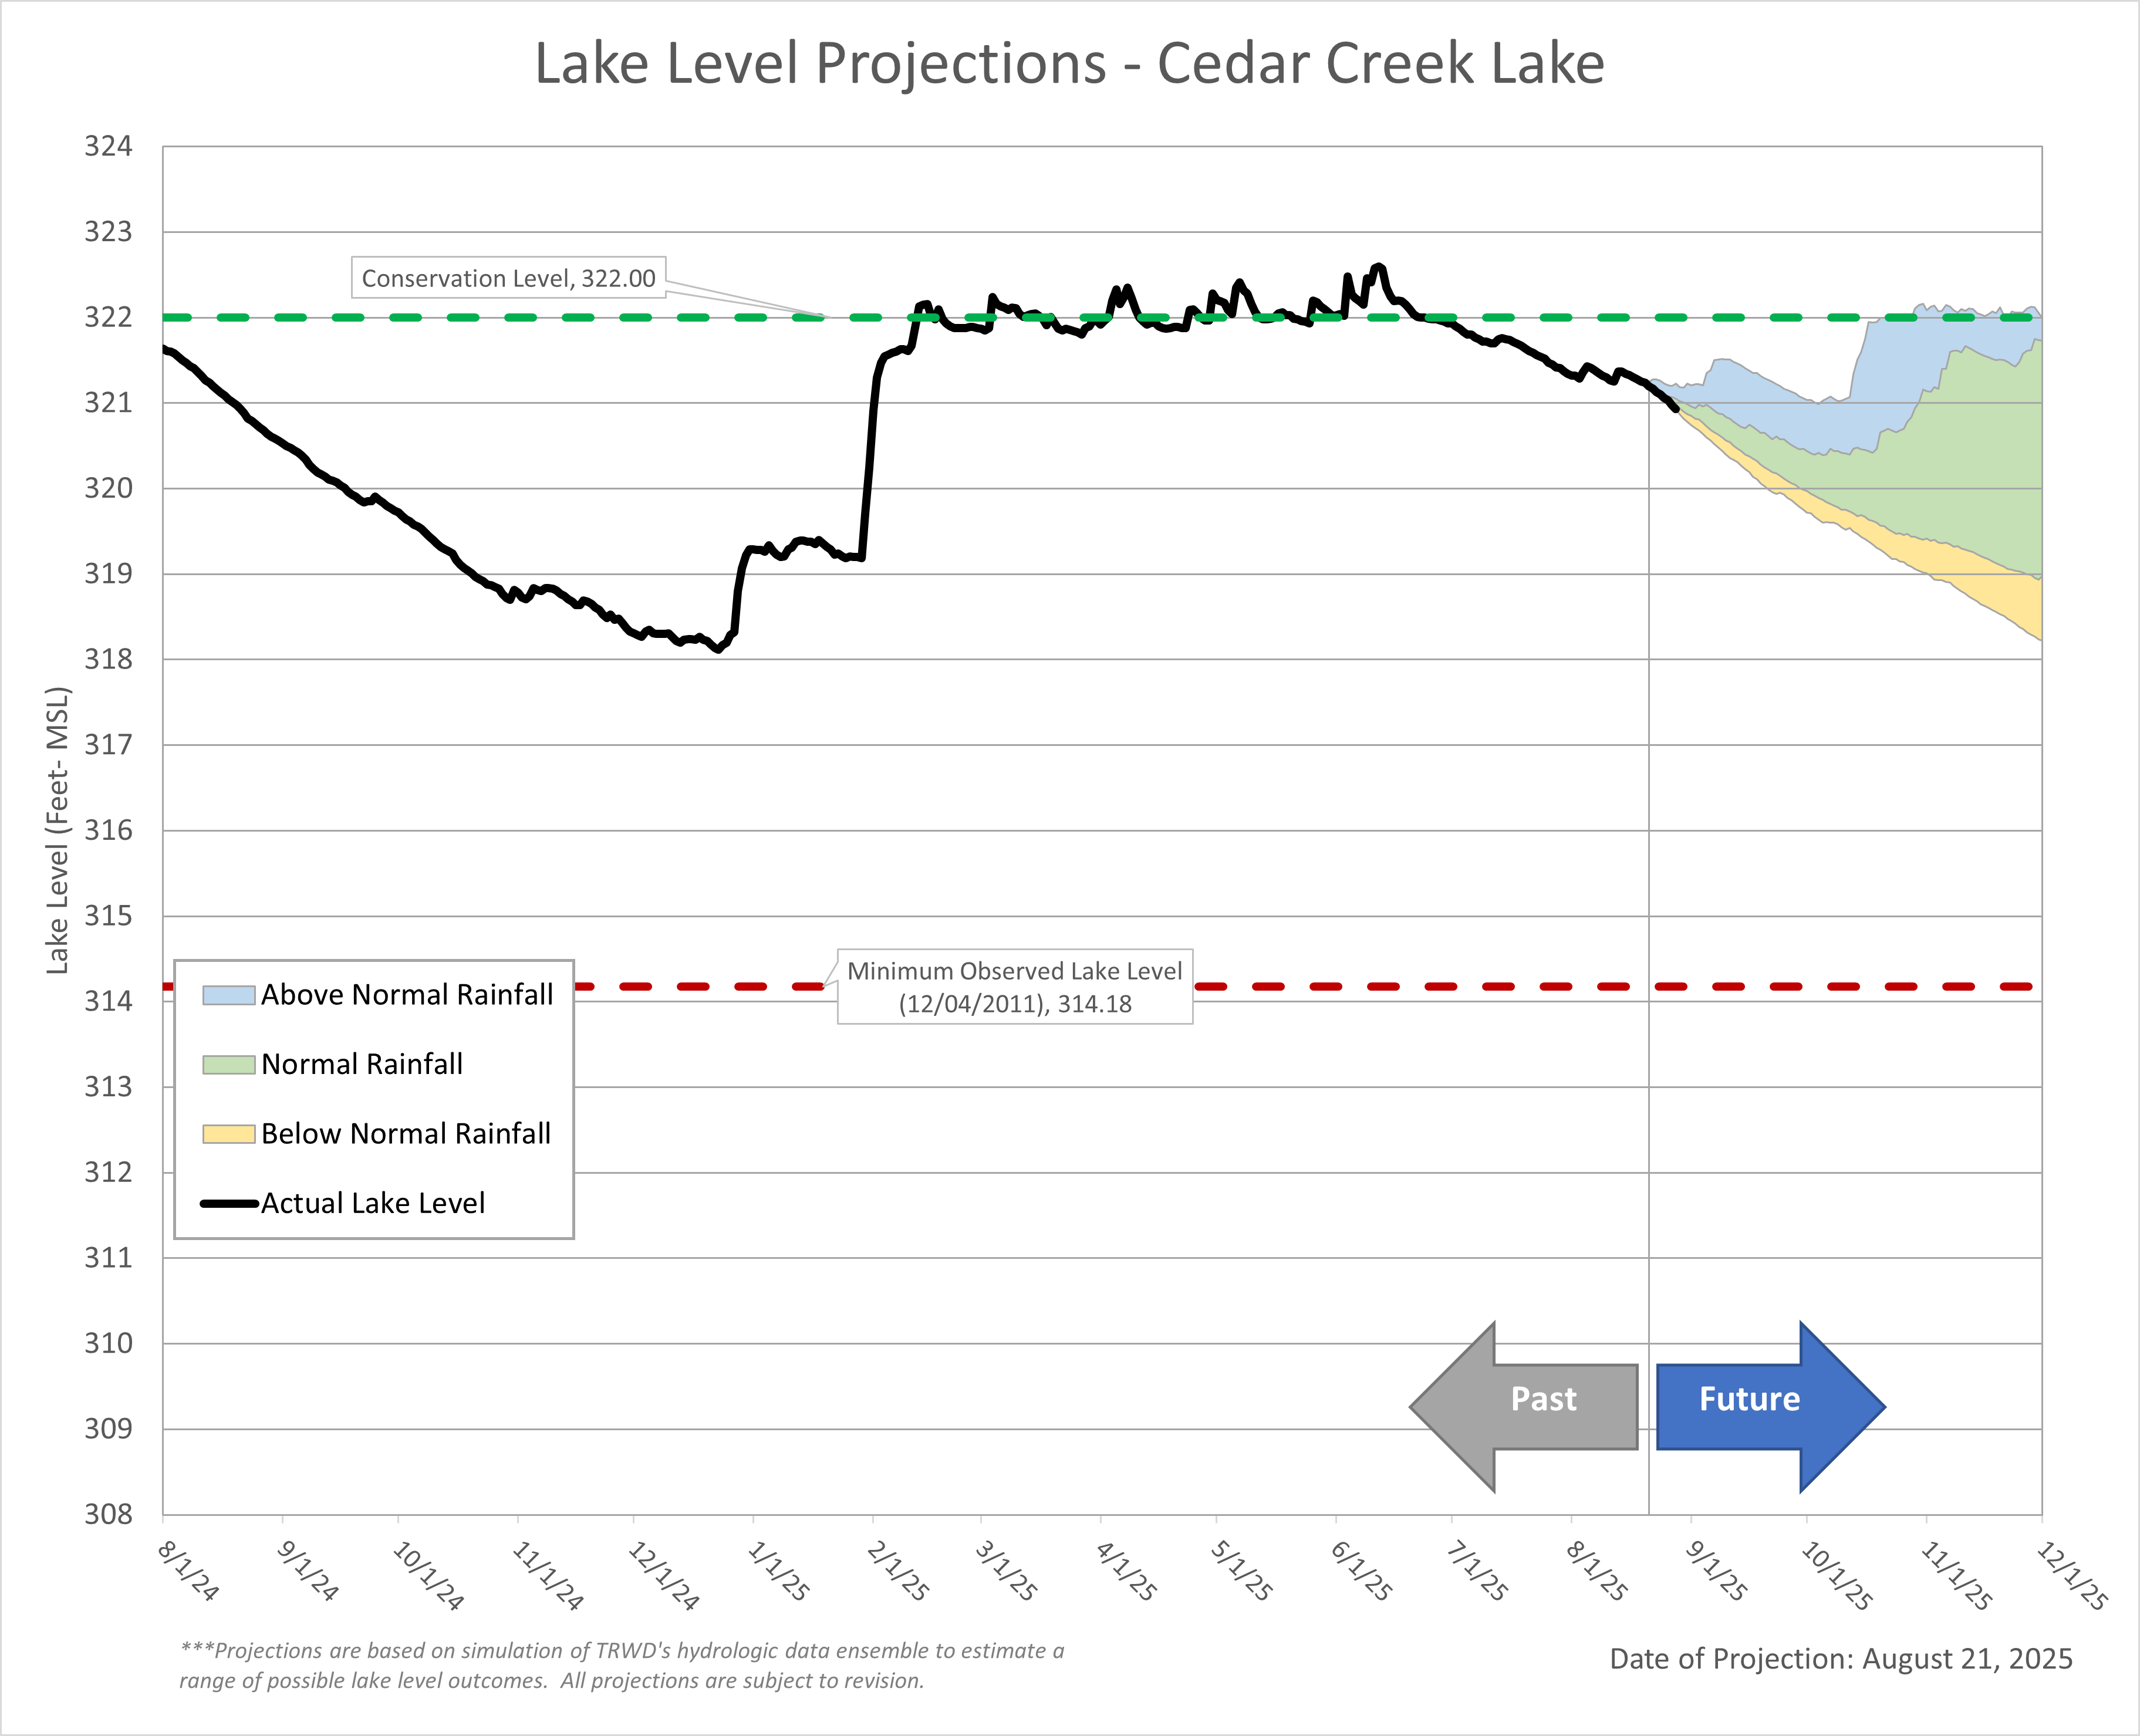
- The latest lake level projections (see below).
- Links to historical lake level plots.
- Past projections compared to actual outcomes.
Thank you for following the Lake Level Blog. Check back next month for more updates!
TRWD Watershed Rainfall
30-Day Rainfall Totals
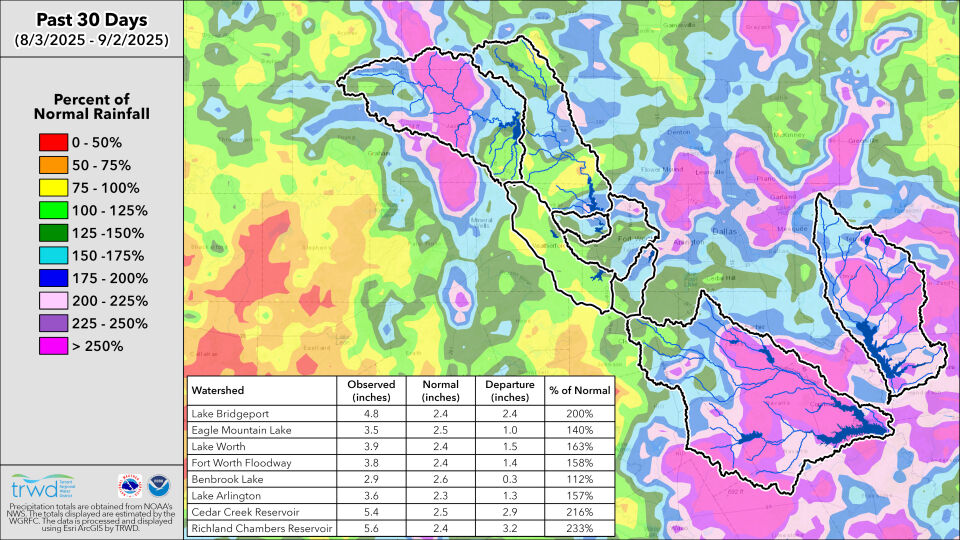
TRWD Lake Rainfall Totals through August 31, 2025
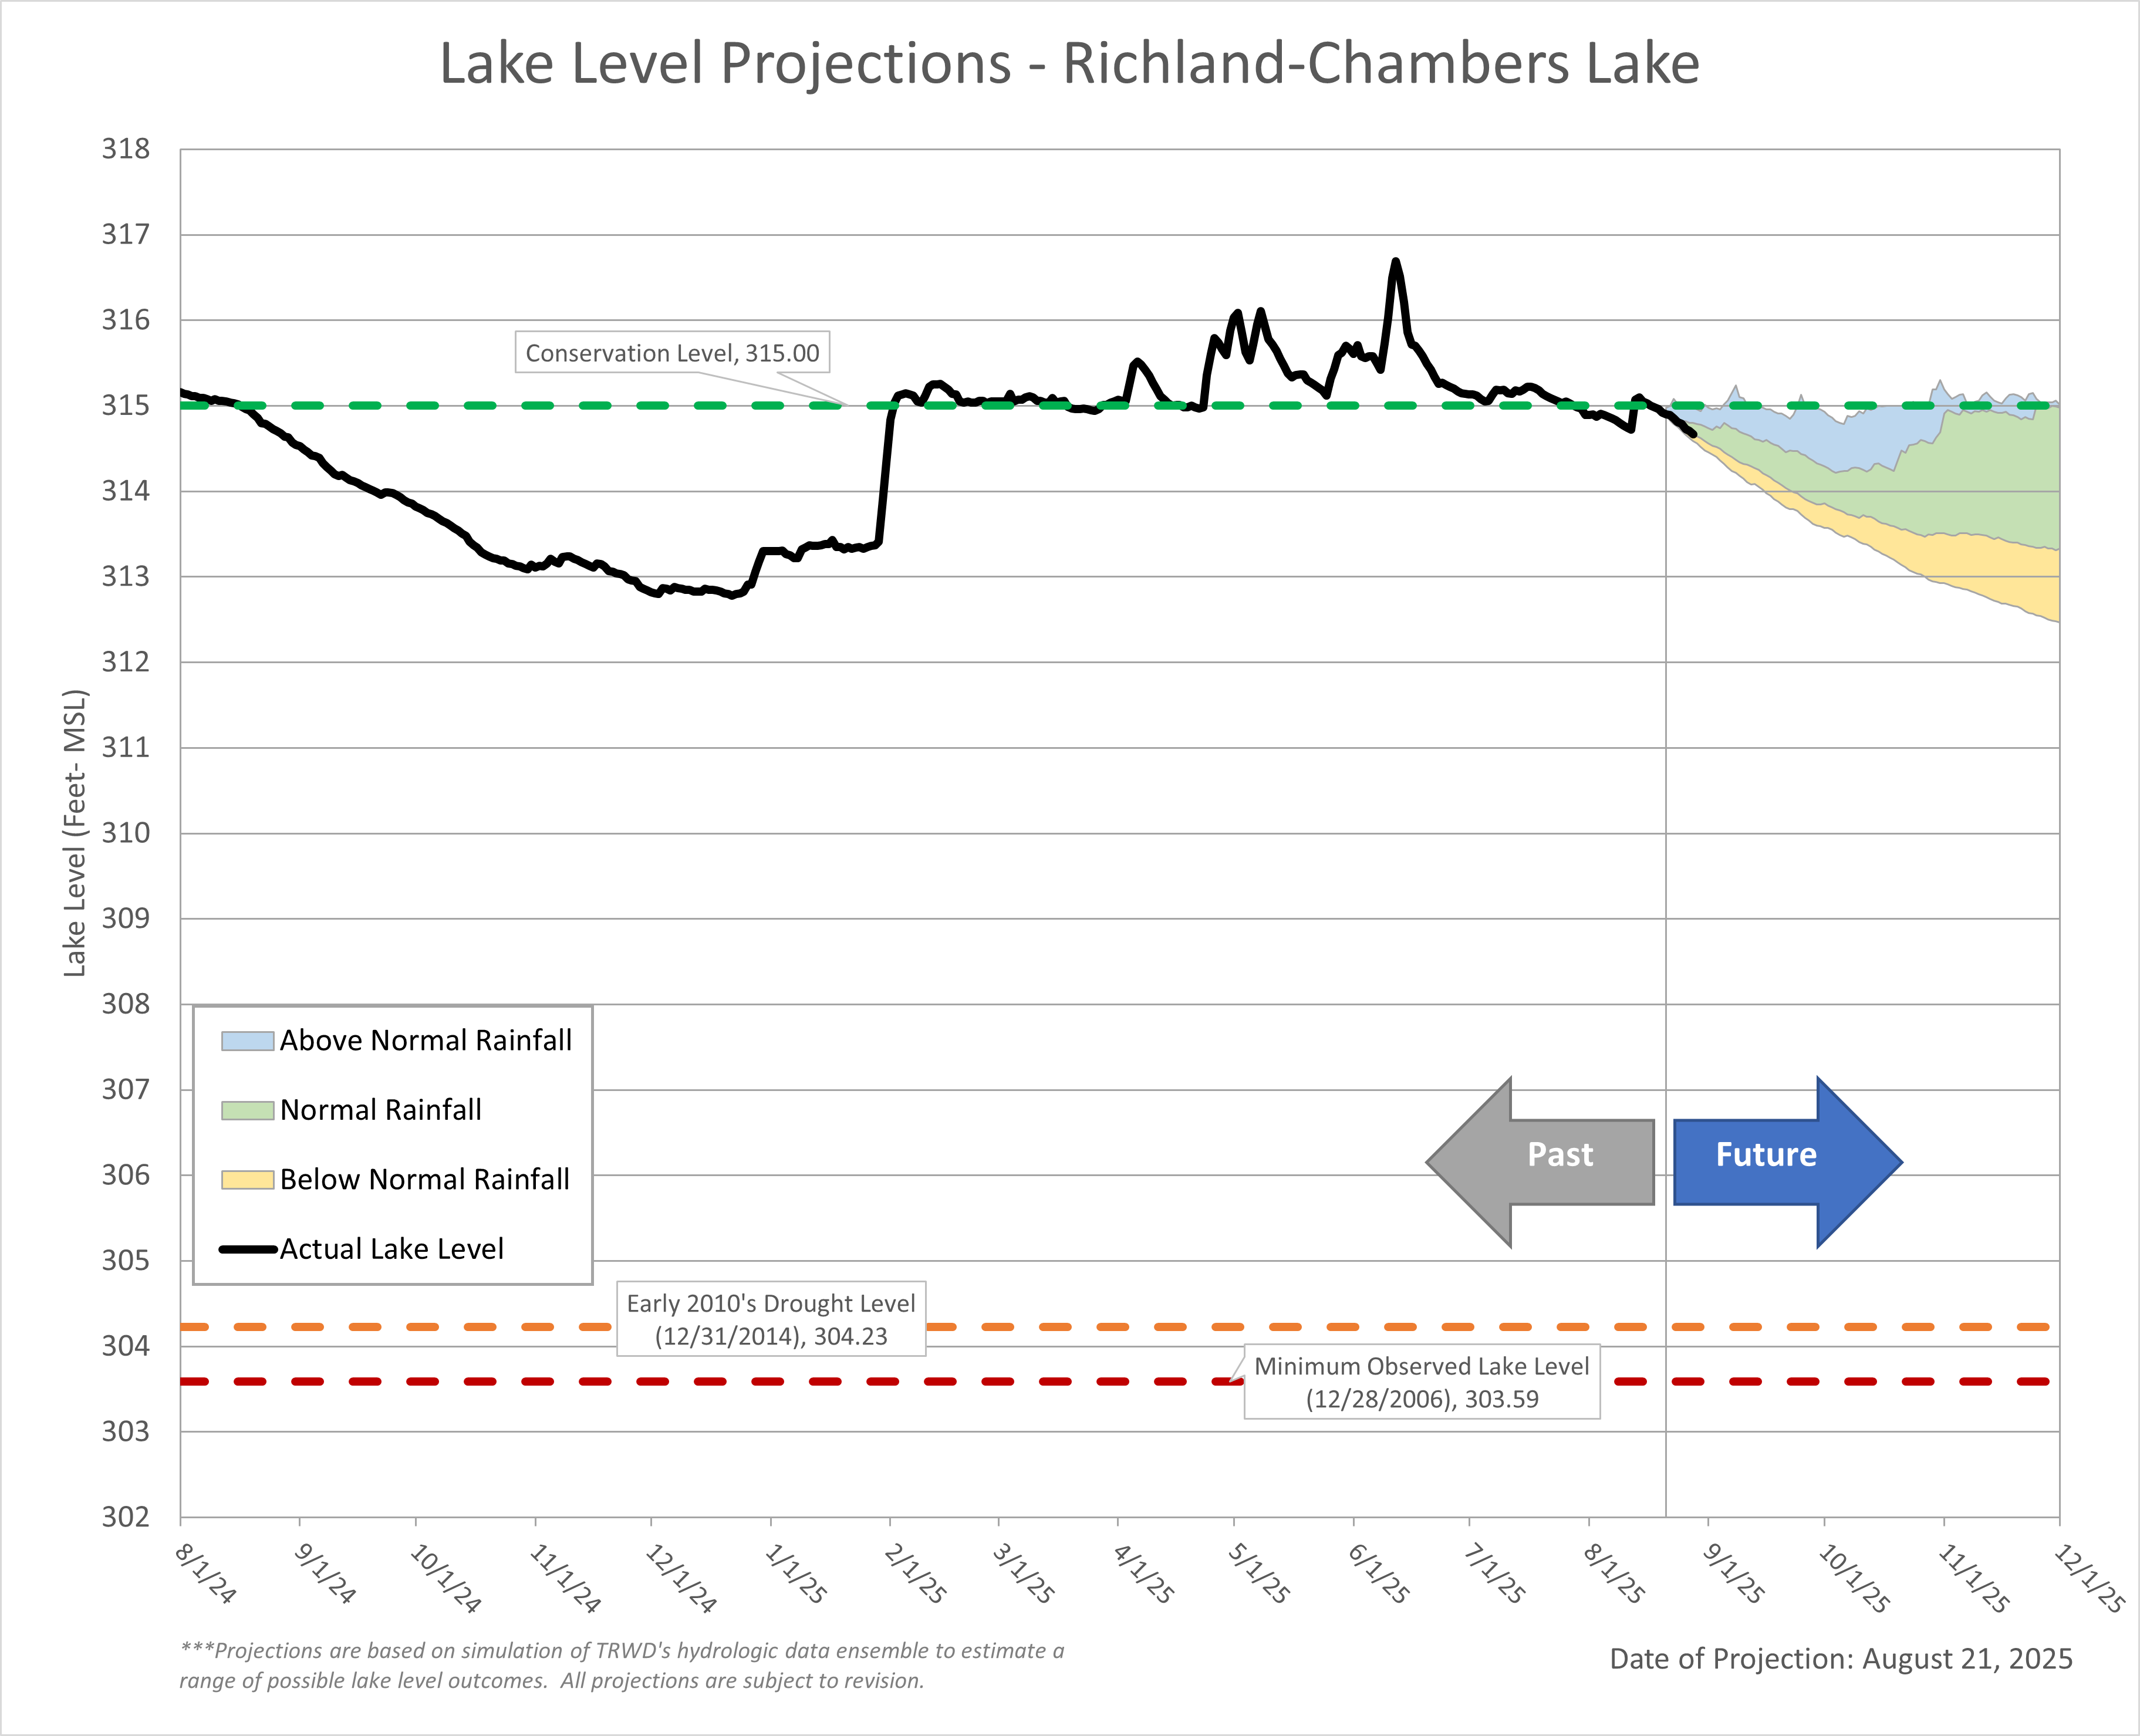
Lake Level Projection
Lake Bridgeport
Eagle Mountain Lake

Cedar Creek Lake
Richland-Chambers Lake
Acknowledgments:
- Weather Insights: Special thanks to Courtney Jalbert, TRWD’s Meteorologist, for providing detailed weather insights and forecasts.
- Reservoir Projections: A big thank you to Vini de Oliveira for his timely reservoir projections.
- Rainfall Analysis: Appreciation goes to Ashley Lowrie for her thorough analysis of observed rainfall.
- Editorial Review: Special thanks to Victoria Cason for her thorough editorial review.