The latest round of lake level projections are shown below. You will also find:
- Links to historical lake level plots
- Last month’s projections compared to what actually happened.
Lake levels are highly influenced by rainfall. In general, recent rainfall totals have been below normal, leading to the falling lake levels. The “From our Meteorologist” discussion provides insight into what could be expected this coming month in terms of rainfall chances. Thank you for following the Lake Level Blog and check back next month about this time for more projections.
From our Meteorologist
First the bad news…
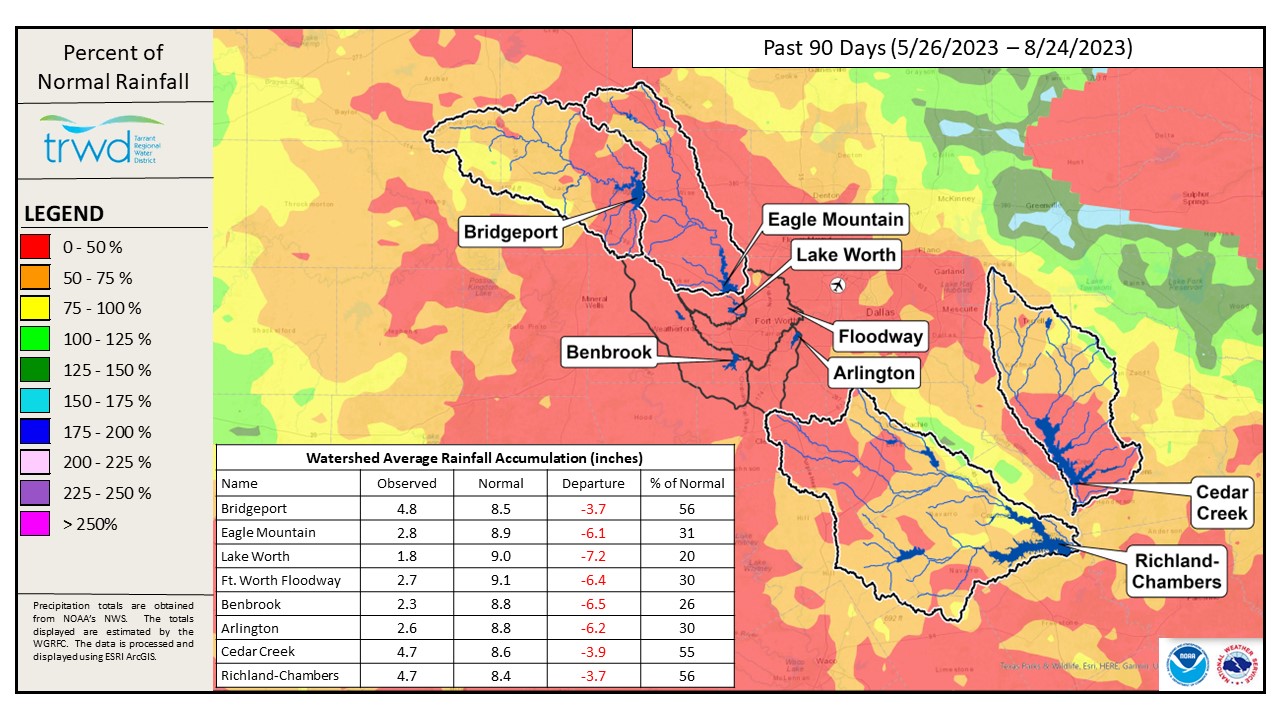
Excessive heat and minimal rainfall have intensified drought conditions across North Texas this summer. 2023 will go down as one of the hottest/driest summers on record. 2023 is climbing the Top 10 list for total and consecutive 100° days at DFW Airport, currently at 8th for total days and 6th for consecutive days. Rainfall accumulations from June 1st through August 24th rank among the lowest through the area, including some regions in Central Texas breaking the records of rain-free days. At DFW there has only been 1.25” recorded since June 1st, which is 6.01” below the normal. If DFW receives less than 0.24 inches over the remainder of the month, 2023 will be the 4th driest summer on record. The map below shows that rainfall in the TRWD watersheds over the last 90 days has been well below normal.
Now for the better news…
Some welcome changes in the weather will take place later this weekend through early next week with the passage of a cold front. While it doesn’t appear to be drought busting, the chances of scattered showers and thunderstorms will be welcomed across North Texas. Temperatures should remain below 100° for a few days. Looking ahead to September, there does not appear to be any change to the above normal temperature forecast regime and there are no strong indicators of a wet or dry September according to the Climate Prediction Center. So while the ongoing drought may persist for a while longer, El Nino is anticipated to continue through the fall into the early winter.
…and the good news
El Nino tends to favor above normal precipitation during our cold seasons. With the influence of El Nino and other factors, the latest models from the Climate Prediction Center begin leaning toward above normal precipitation beginning in the November, December, and January time frame.
Projections
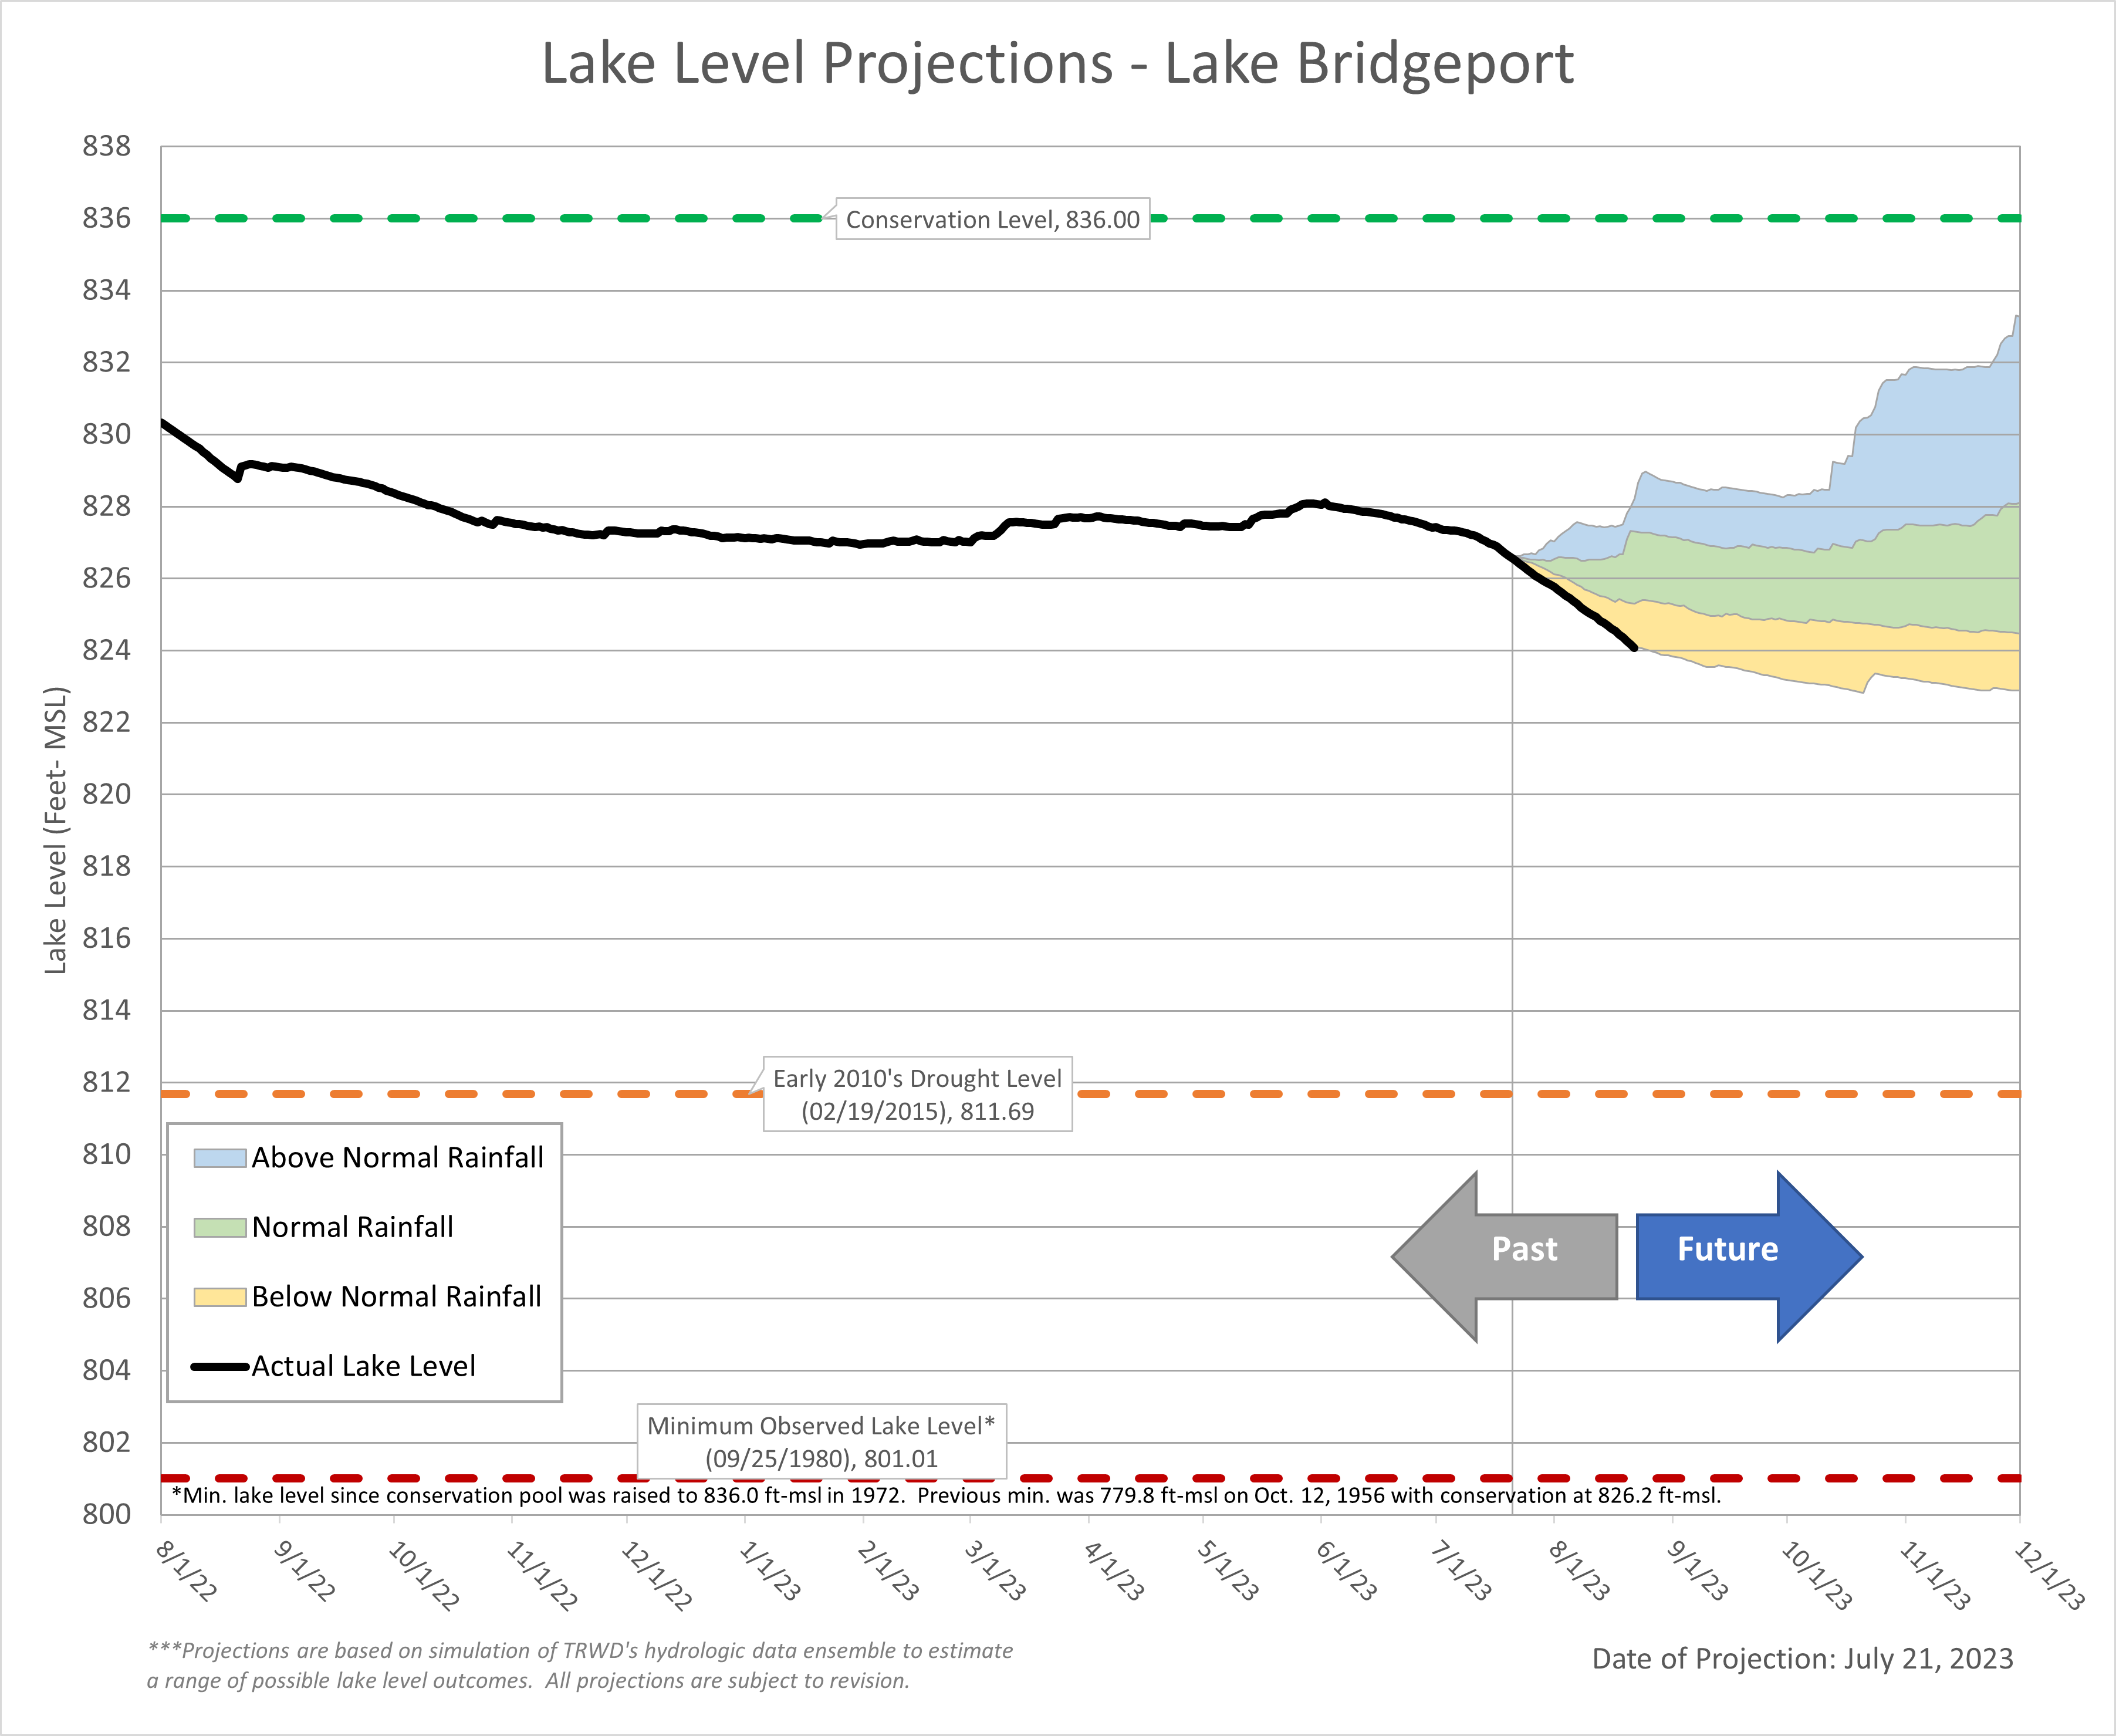
Lake Bridgeport
 Last Month’s Projection
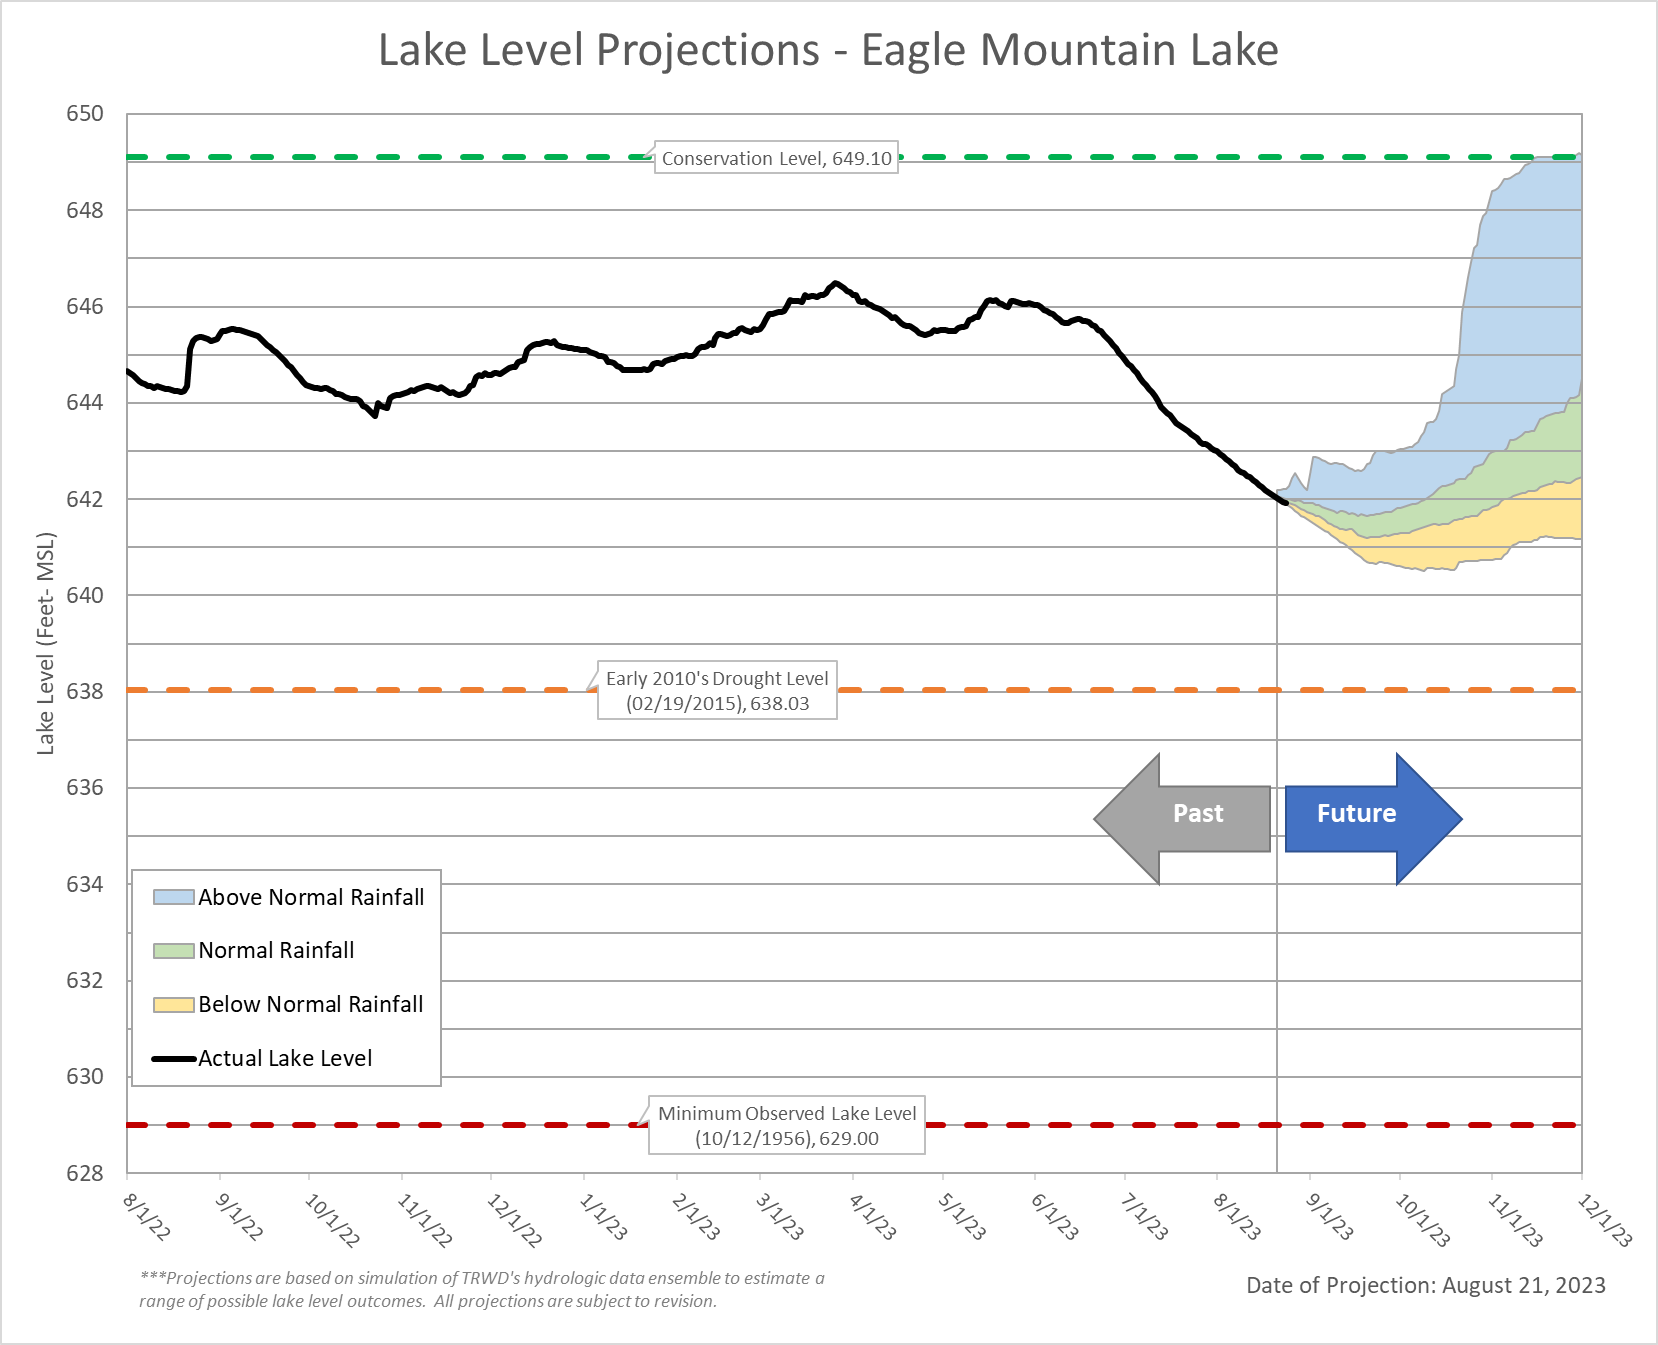
Eagle Mountain Lake
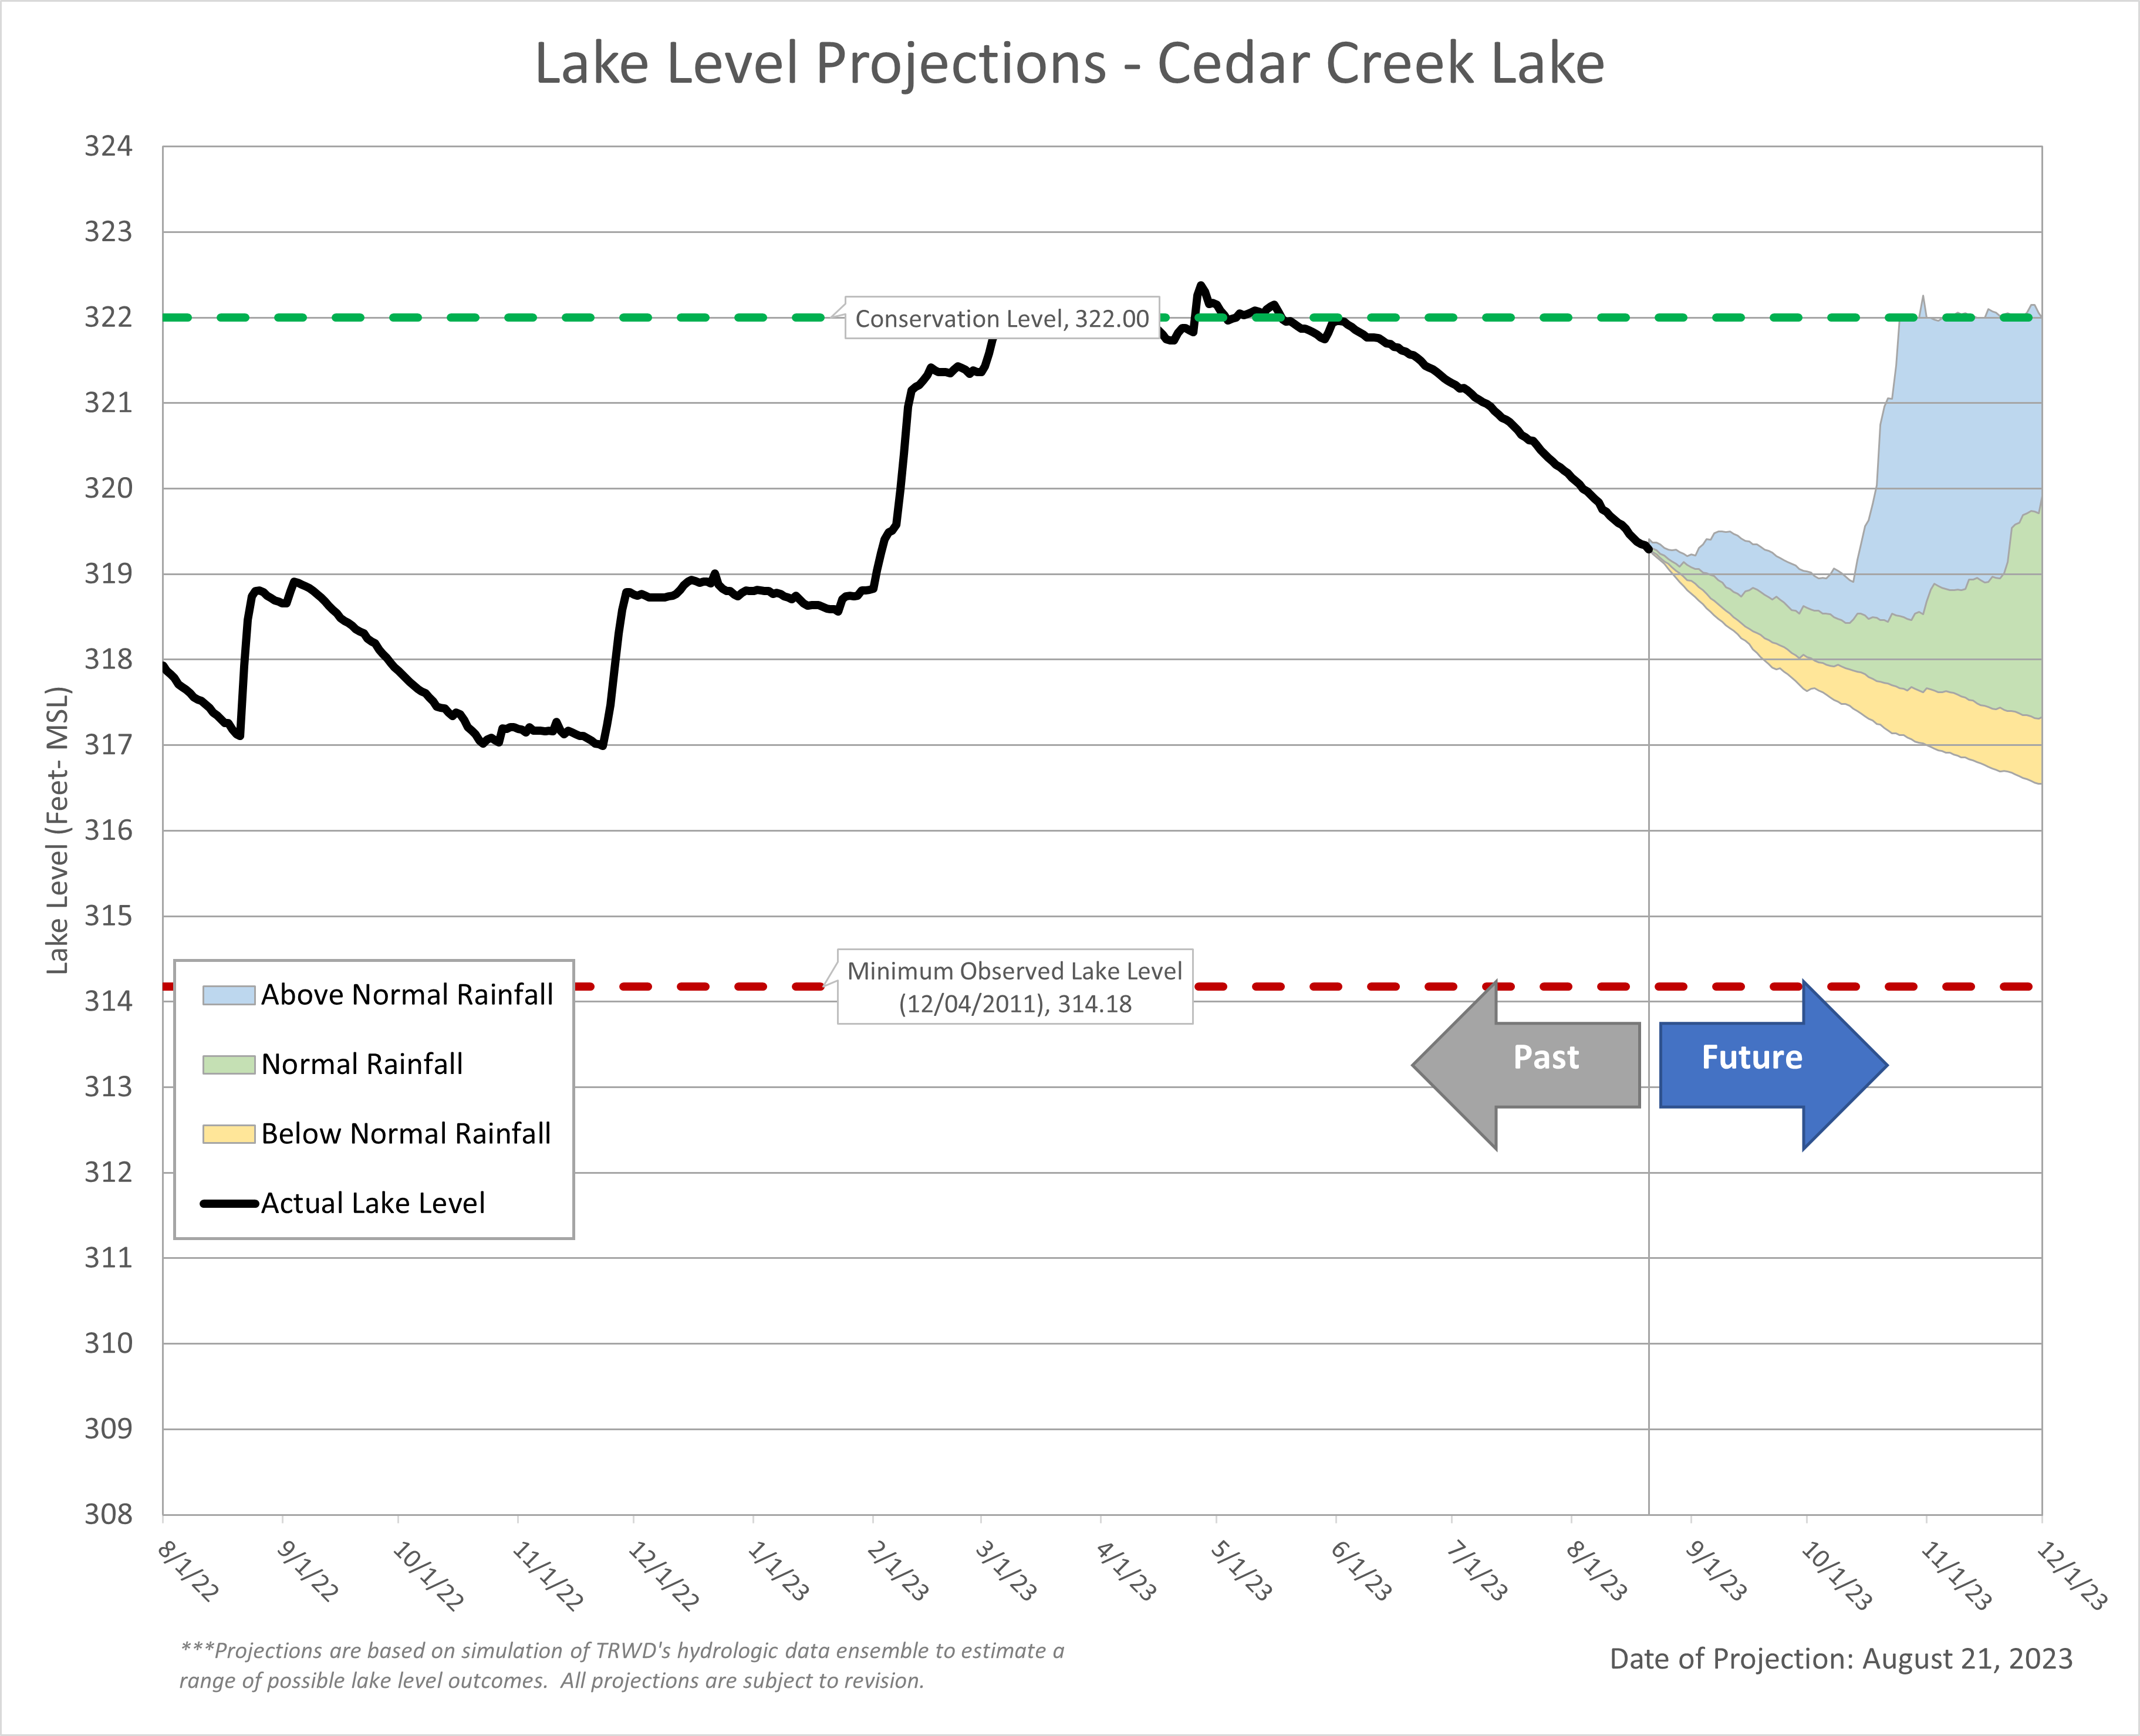
Cedar Creek Lake
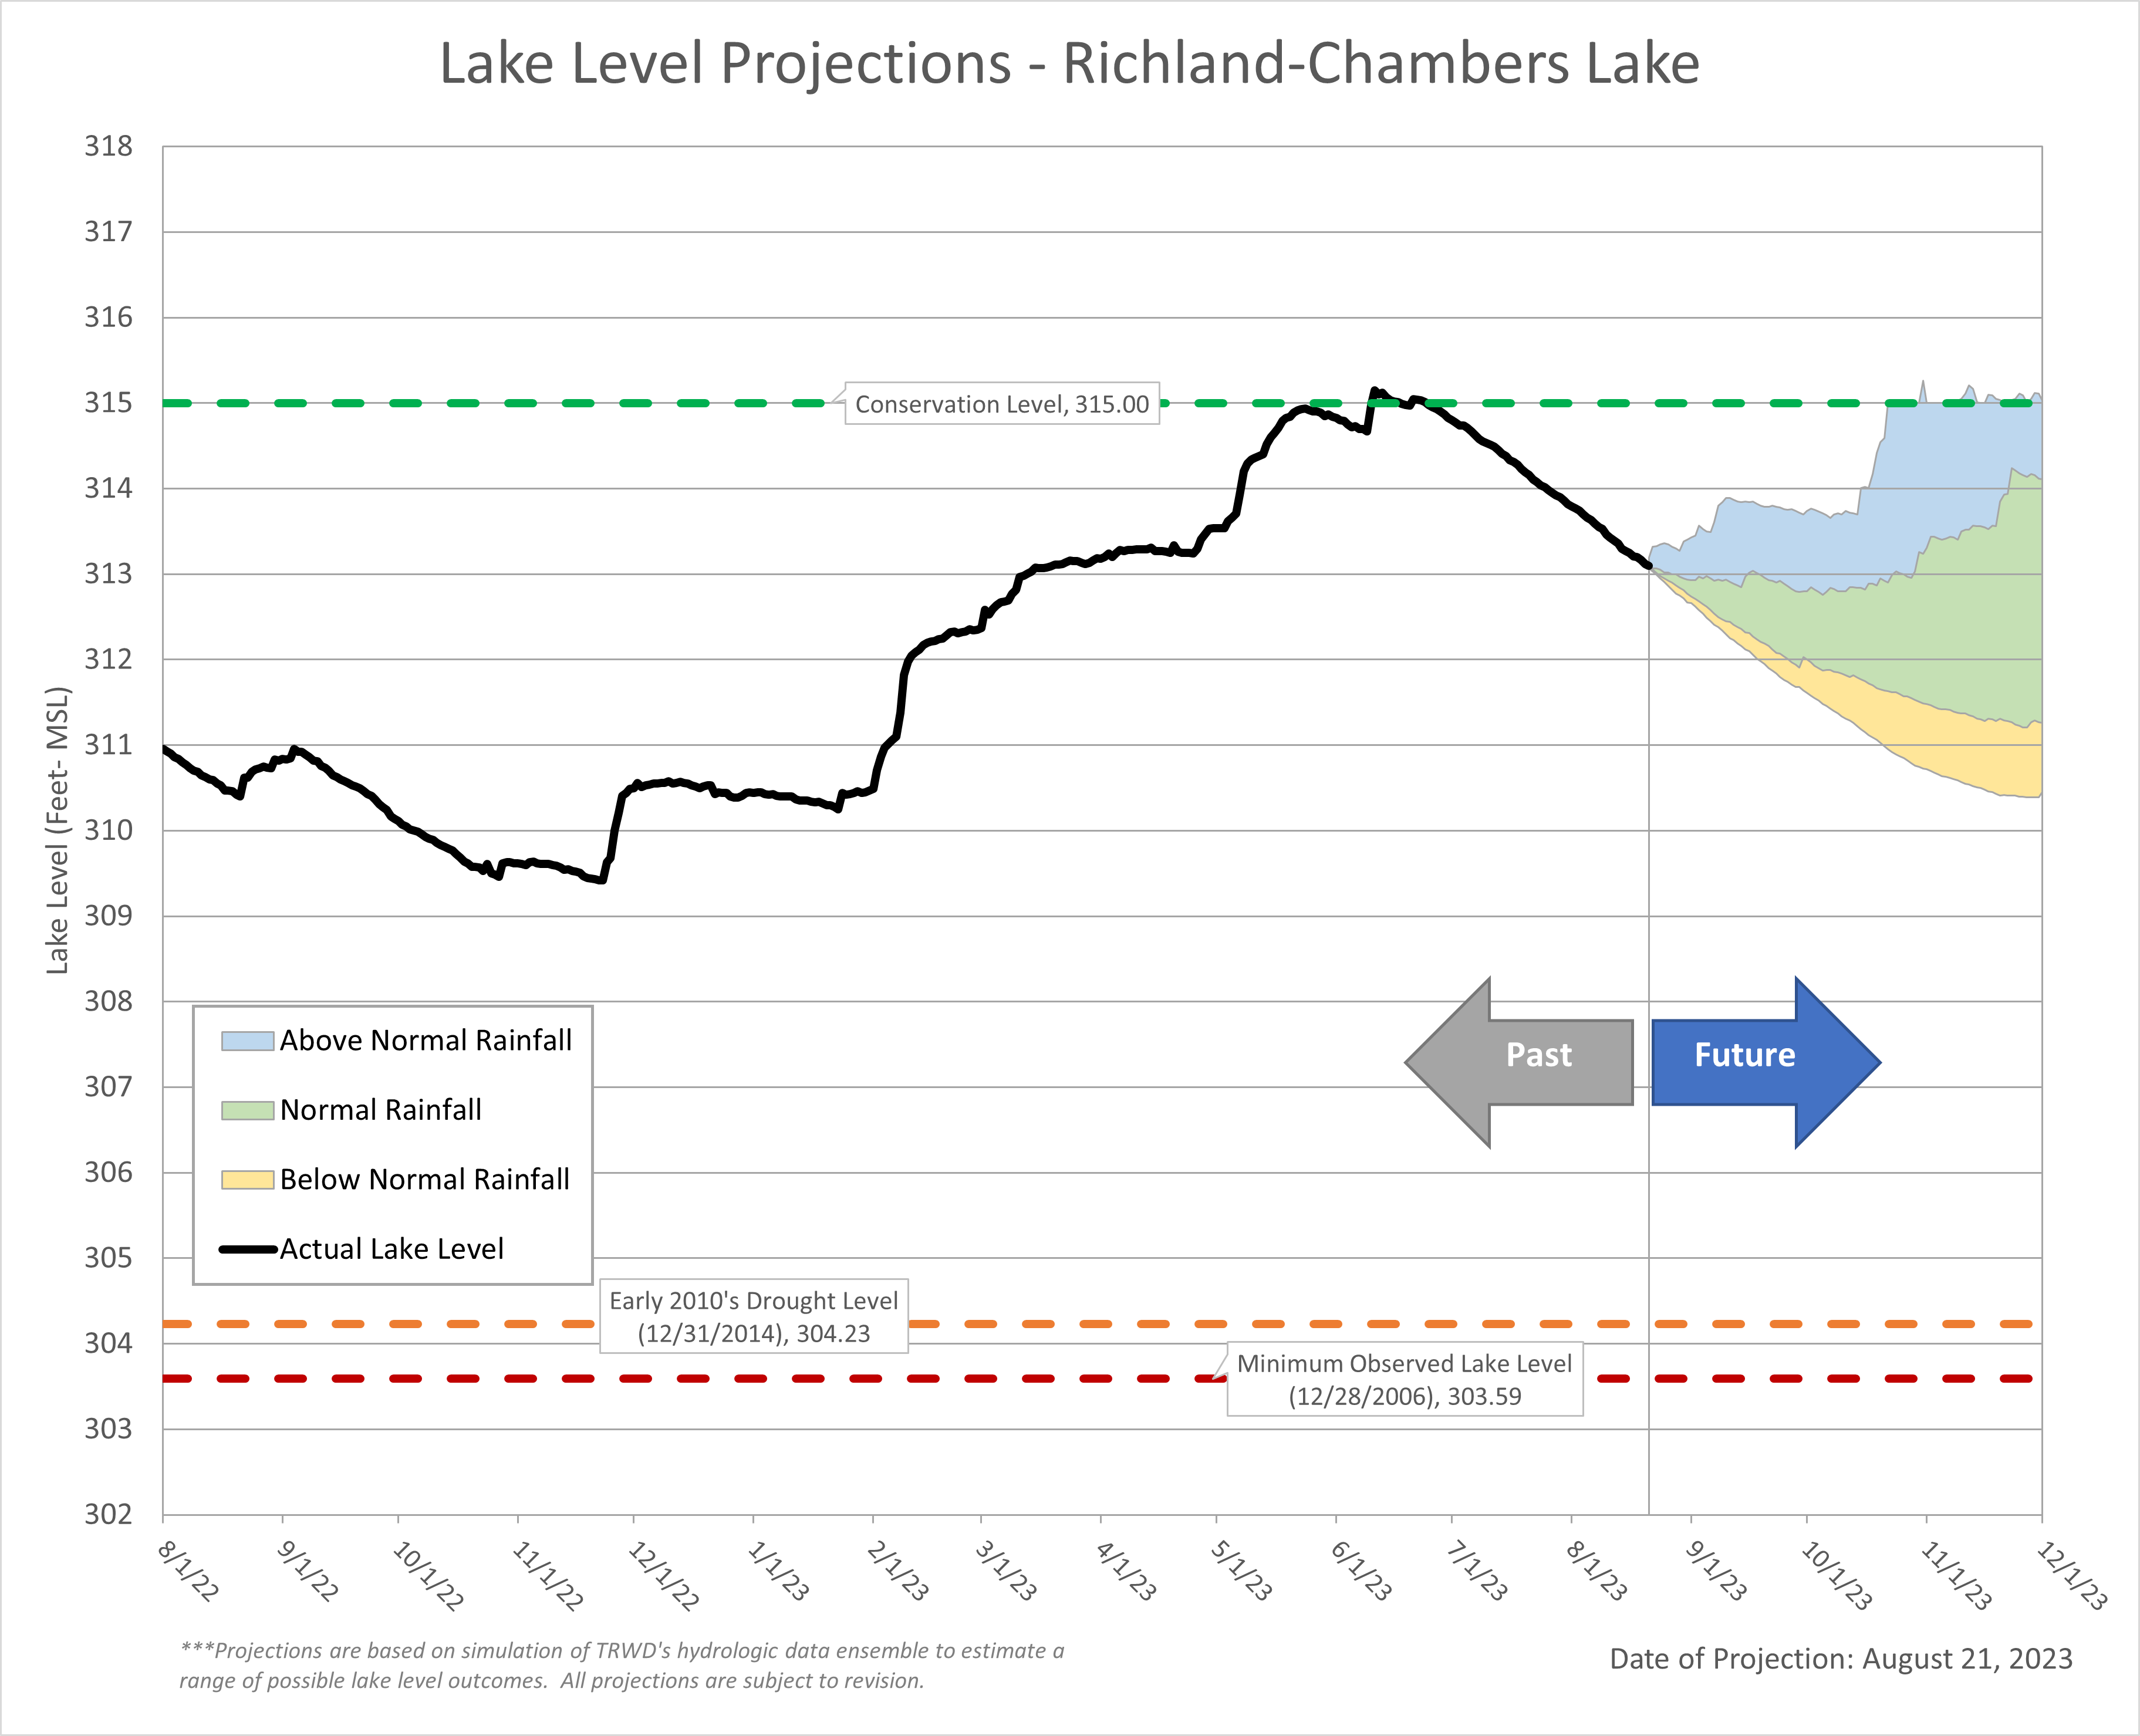
Richland-Chambers Lake