The latest round of lake level projections are shown below. You will also find:
- Links to historical lake level plots
- Last month’s projections compared to what actually happened.
Lake levels are highly influenced by rainfall. In general, recent rainfall totals have been below normal, leading to the falling lake levels. TRWD’s Meteorologist, Courtney Jalbert, provides discussion on what happened in September and where we may be heading in the “From our Meteorologist” section. Thank you for following the Lake Level Blog and check back next month about this time for more projections.
From our Meteorologist
September Summary…
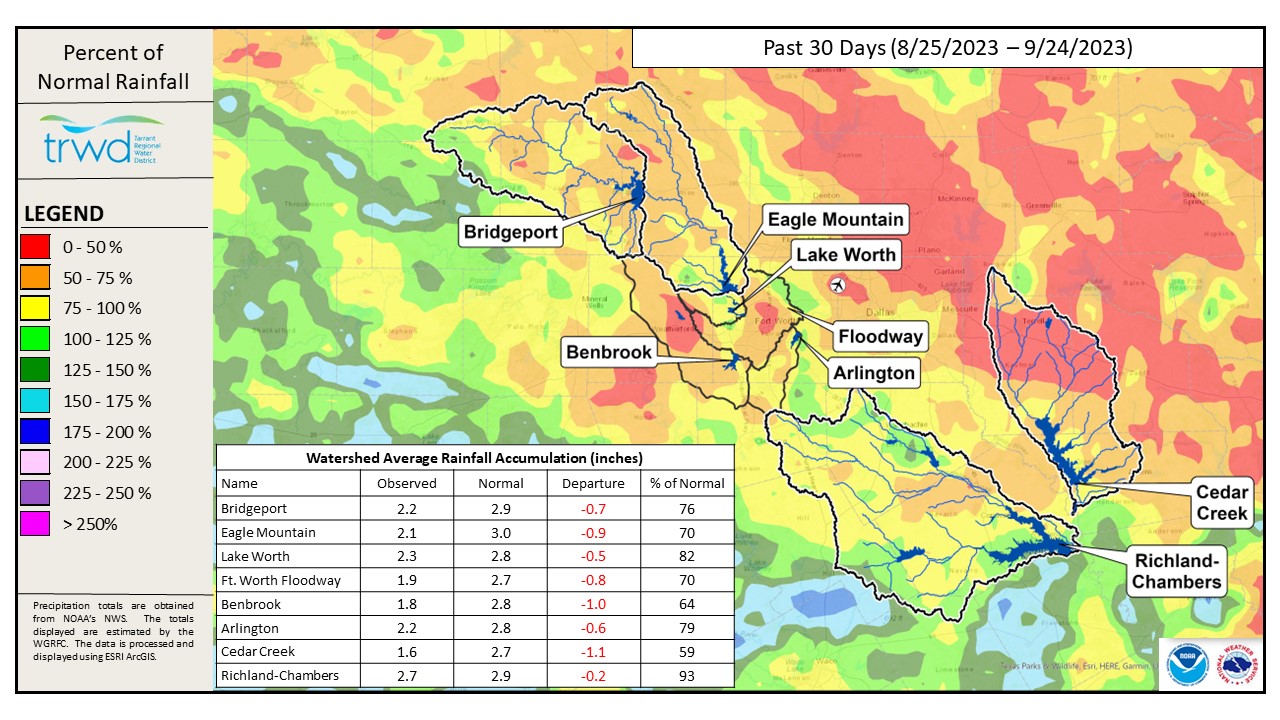
We are into meteorological fall, but Texas is still holding onto summer with a warm and dry weather pattern a little longer. Excessive heat and minimal rain have continued to exacerbate drought conditions in parts of North Texas. September broke the record for the most 100˚ days at DFW airport with a total of 8, beating the year 2000 by 1 day. While not among the top 10 driest, DFW is 1.49” below normal with rainfall accumulations so far for September at 0.83”. A few luckier areas south of the Metroplex and out East fared a little better with rainfall, but deficits will take some time to recover. A large portion of the region is in the D3 exceptional drought category as of September 19th and is expected to persist. Below is a map showing 30-day percent of normal rainfall across the area.
Looking ahead…
Texas will be dealing with the grips of summer type weather for a little while longer before the first true fall frontal passage makes a dent in the heat. The extended models show temperatures cooling off around the second week of October, but the Climate Prediction Center expects the above normal temperatures to hold on for the month of October overall. North Texas, especially Northwestern parts of north Texas have a favorable above normal precipitation probability for the month of October. Extended models continue to show dry conditions until about mid-month when the upper-level pattern shifts and hopefully brings in some much-needed precipitation. The drought may linger for a while longer this fall, but there is hope that El Nino will begin to influence our weather pattern more favorably with above normal precipitation as we head into the late fall and early winter months of 2024. El Nino conditions are currently observed in the Pacific Ocean and are anticipated to continue through the winter months with a greater than 95% chance of extending into January through March 2024.
Projections
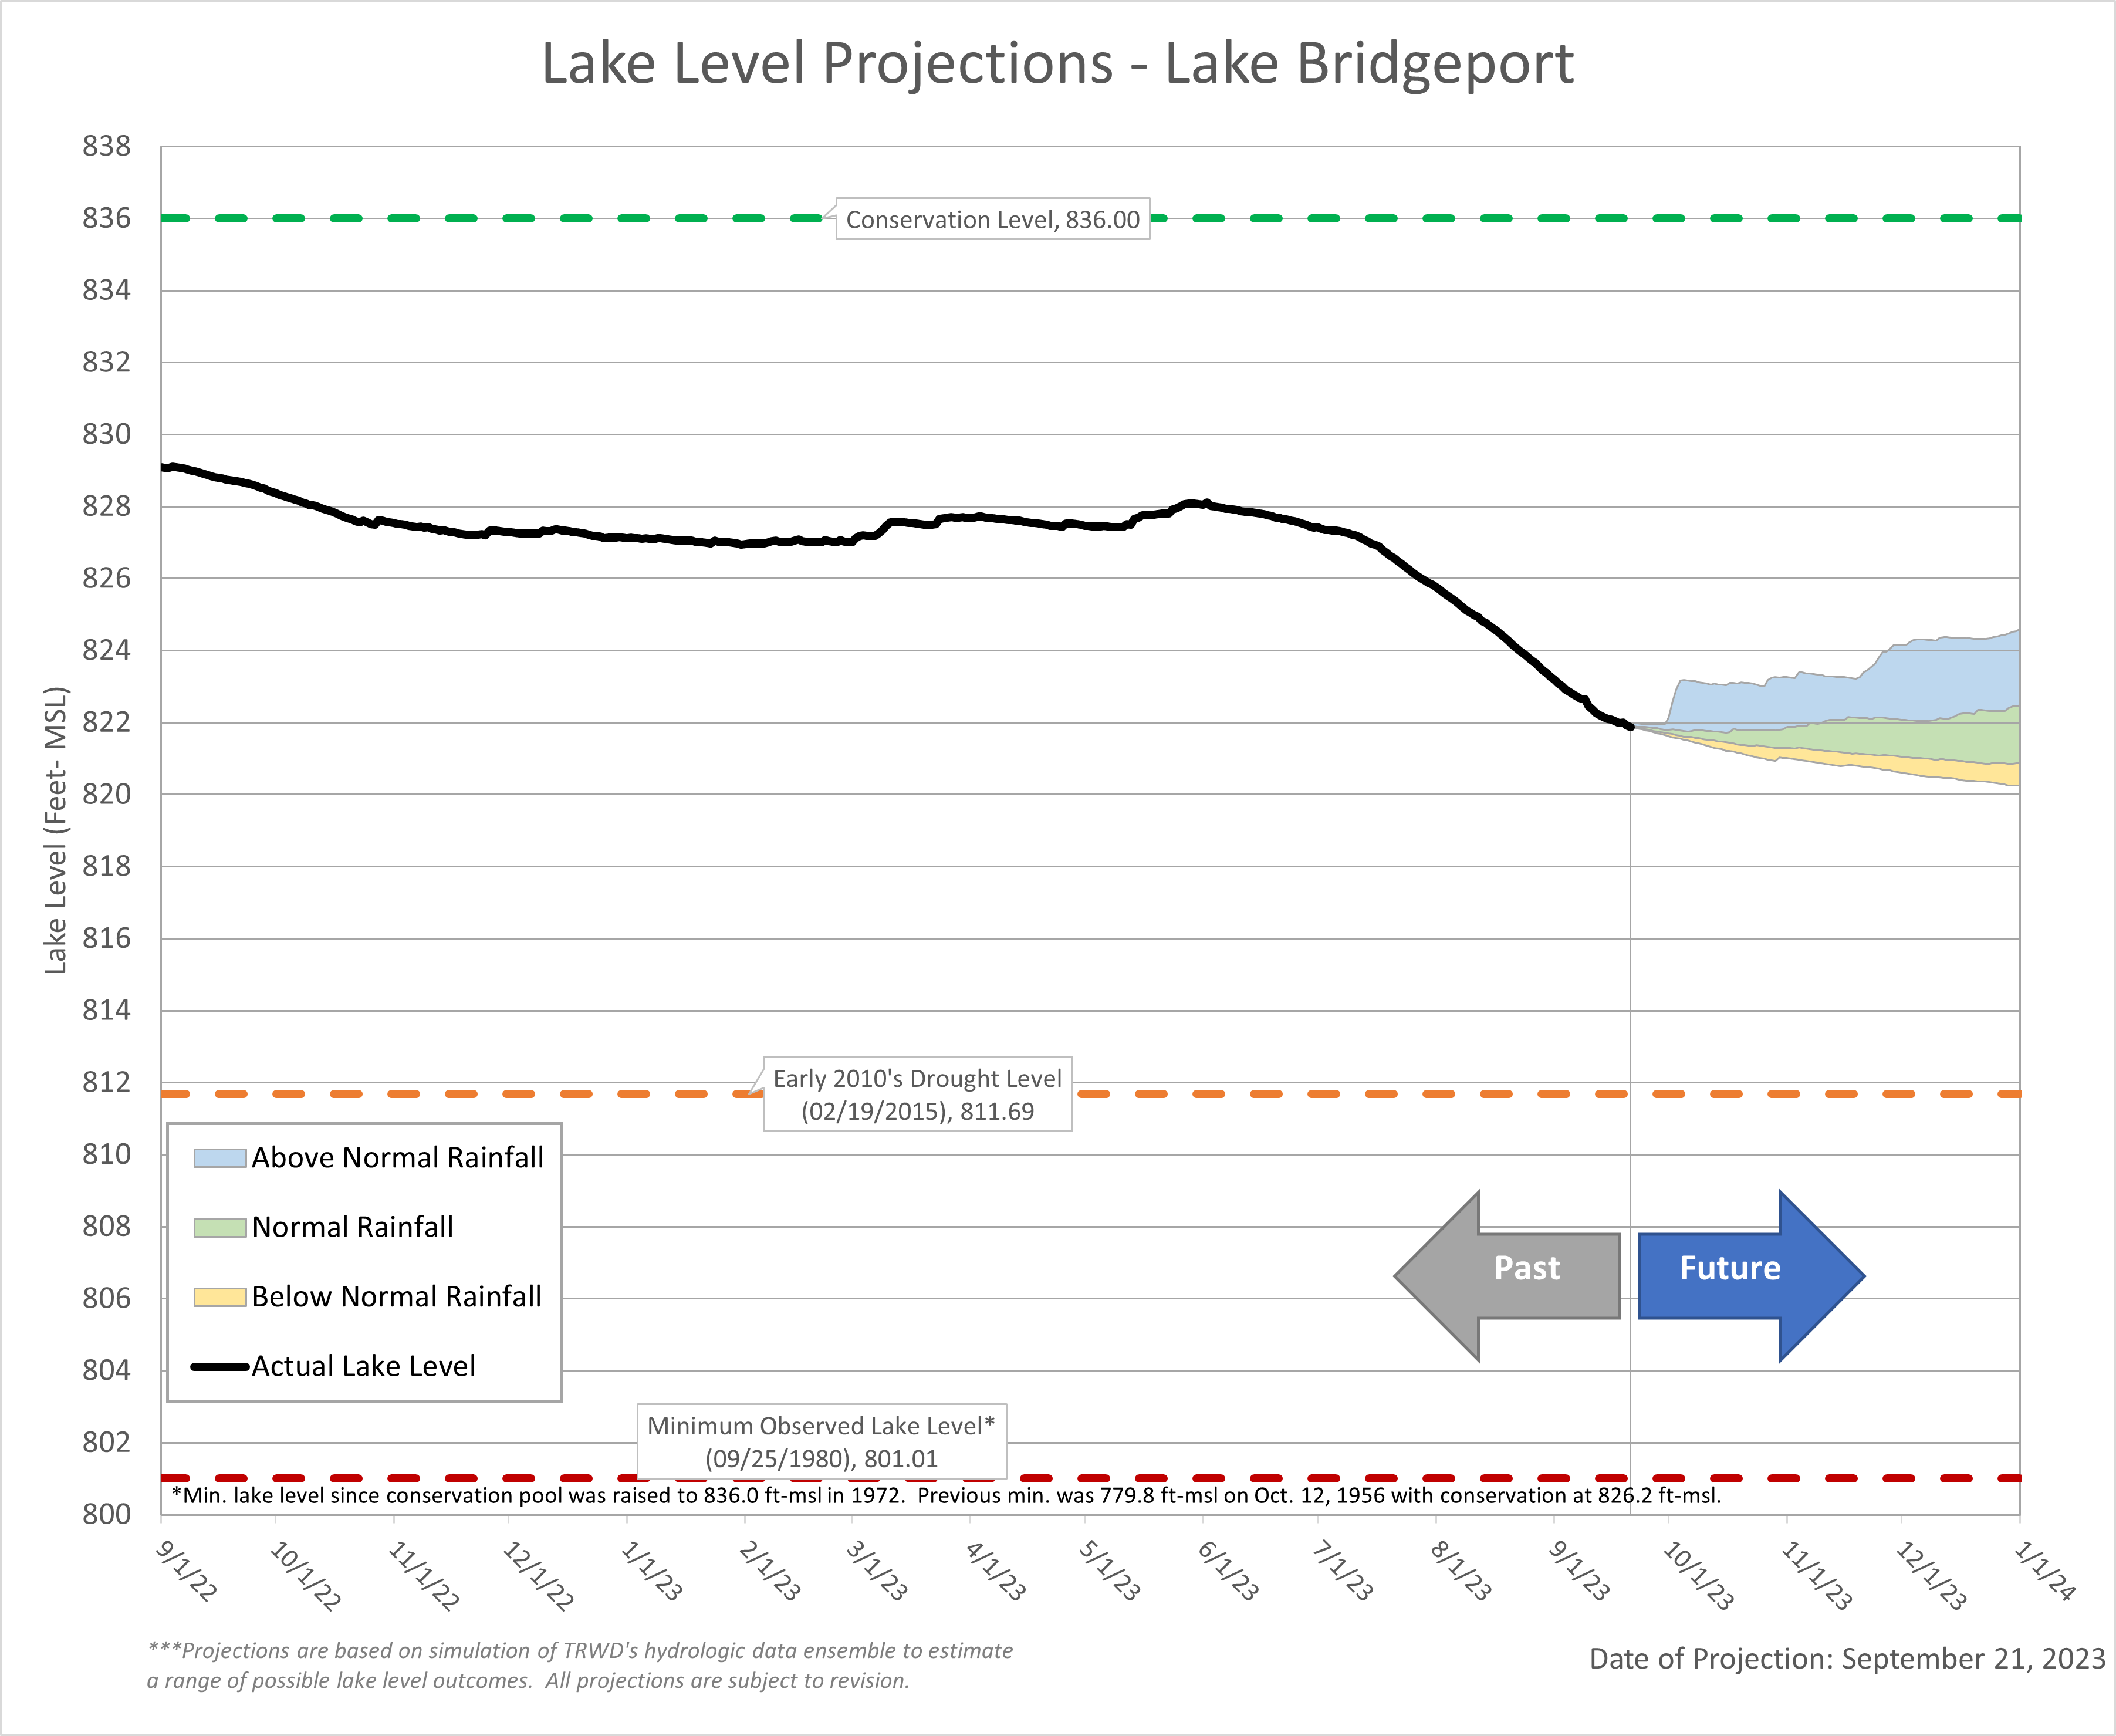
Lake Bridgeport
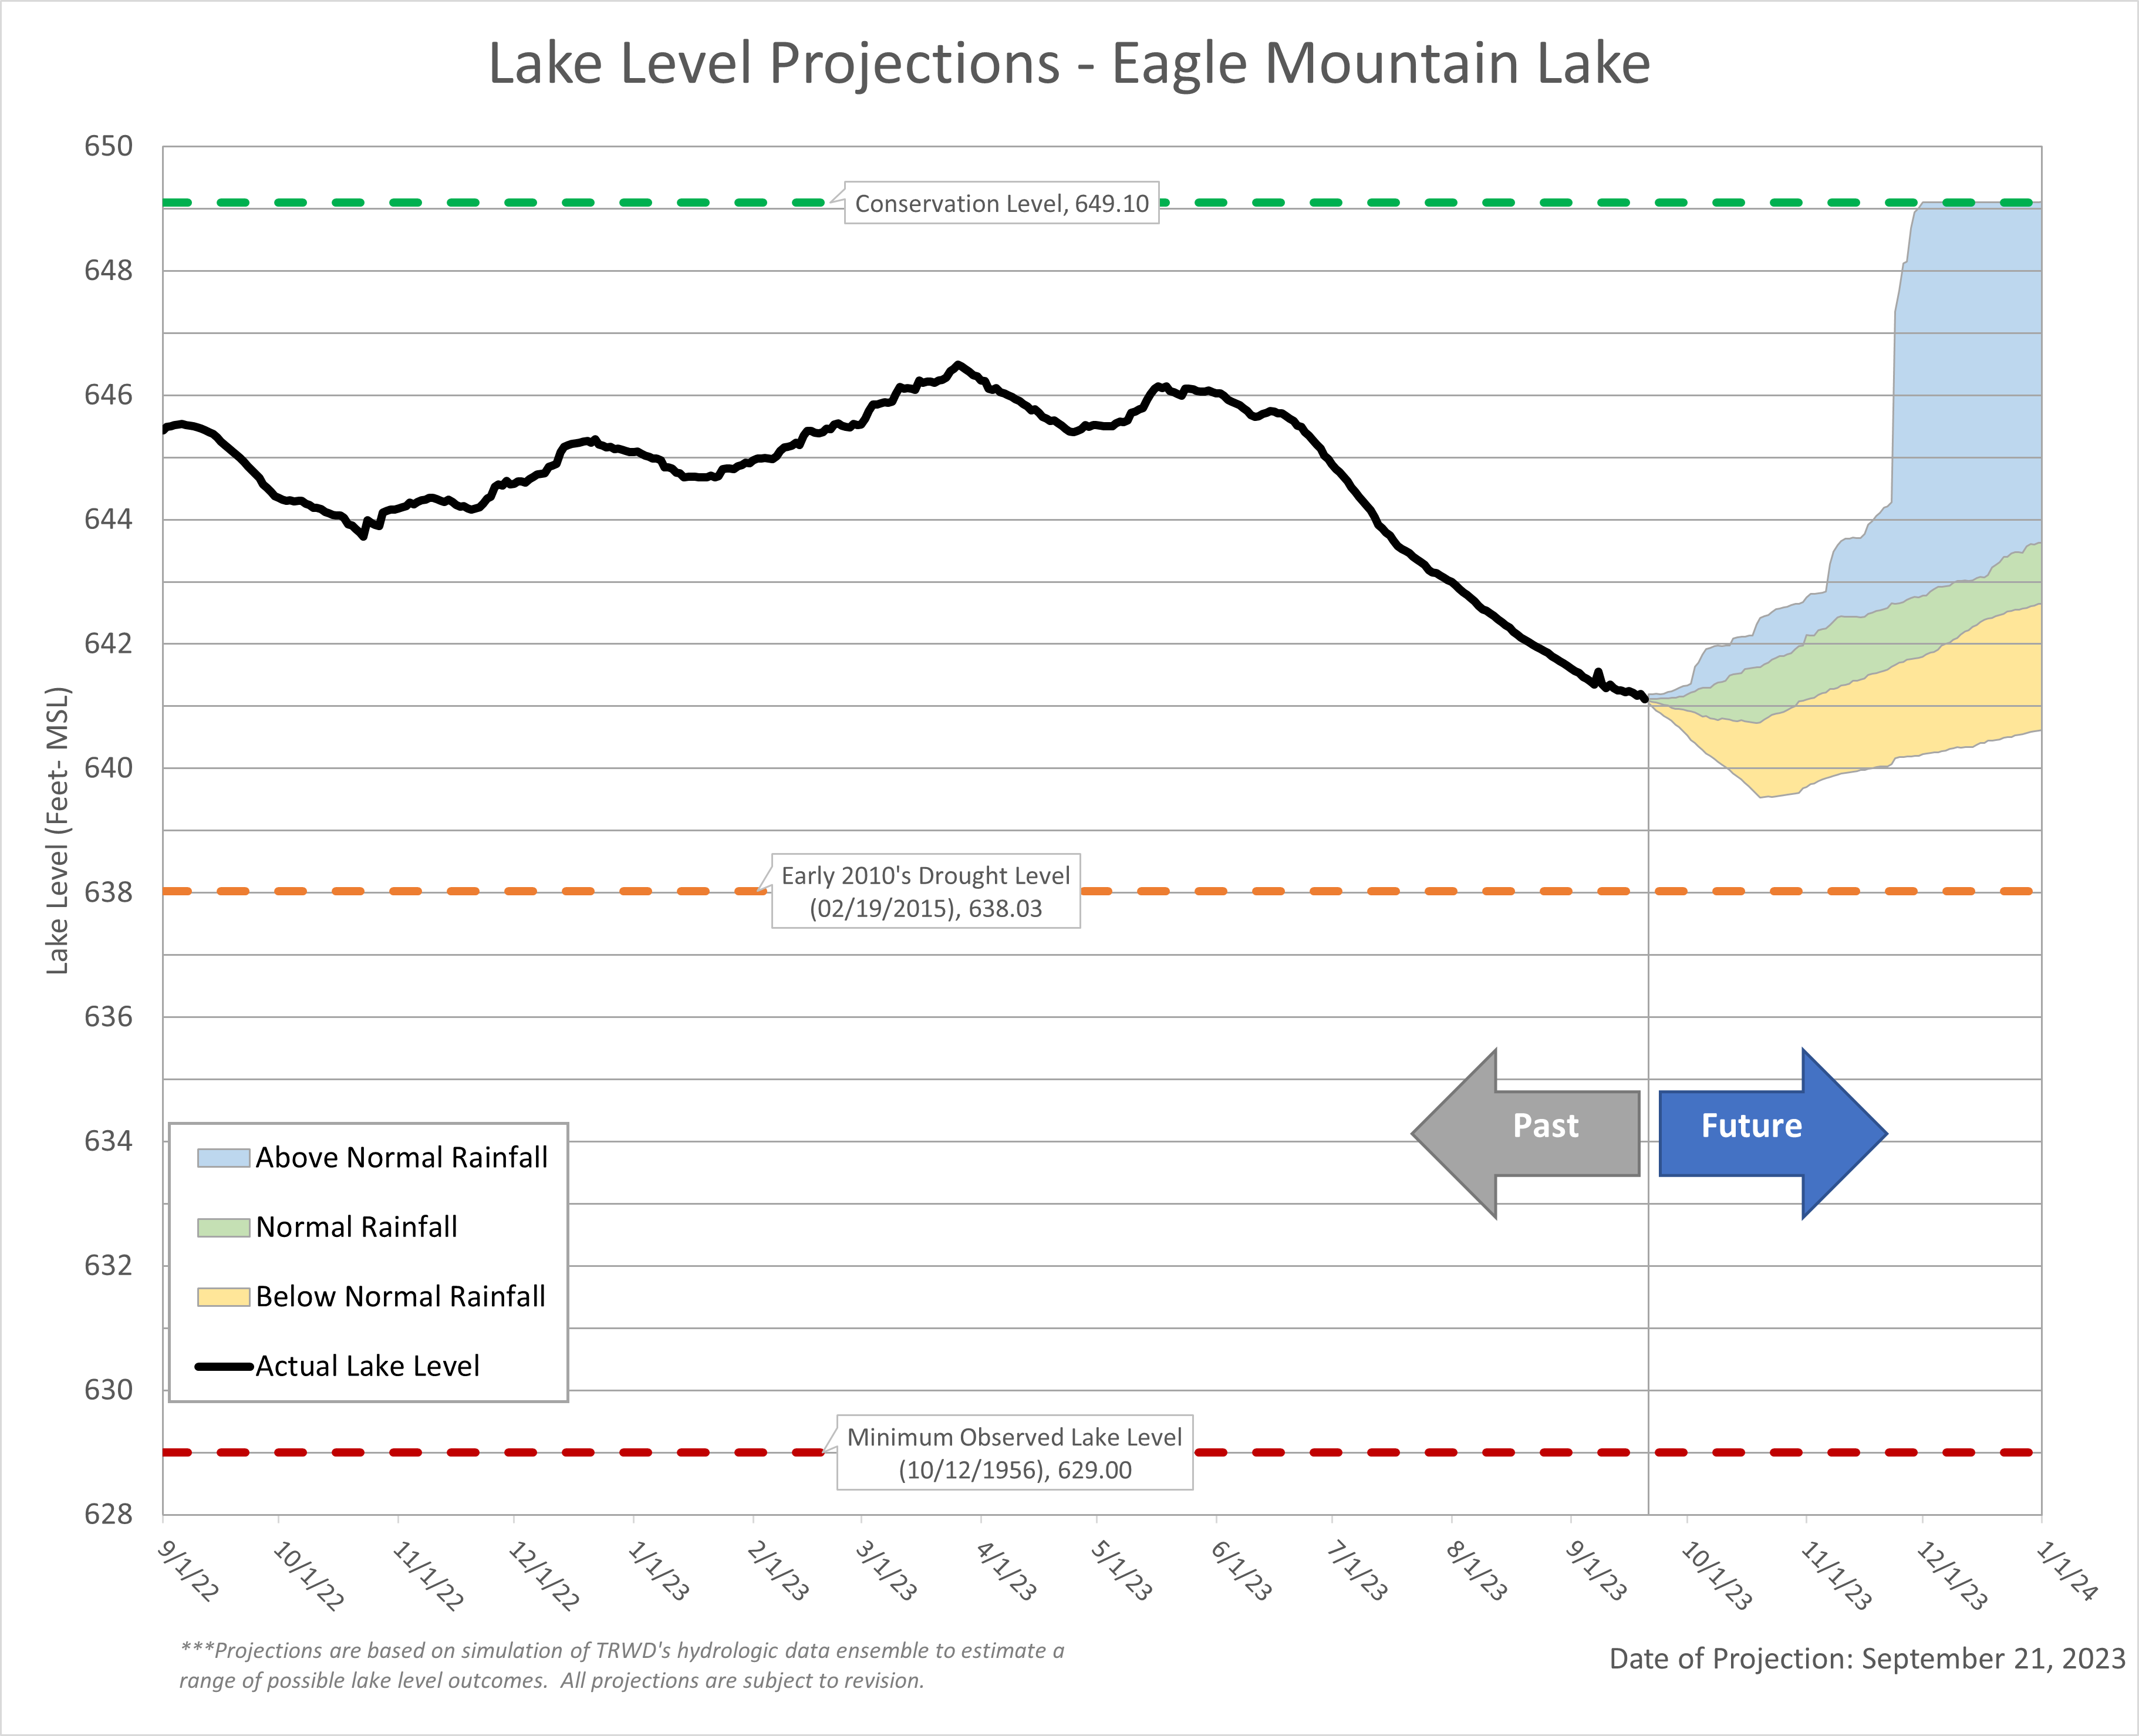
Eagle Mountain Lake
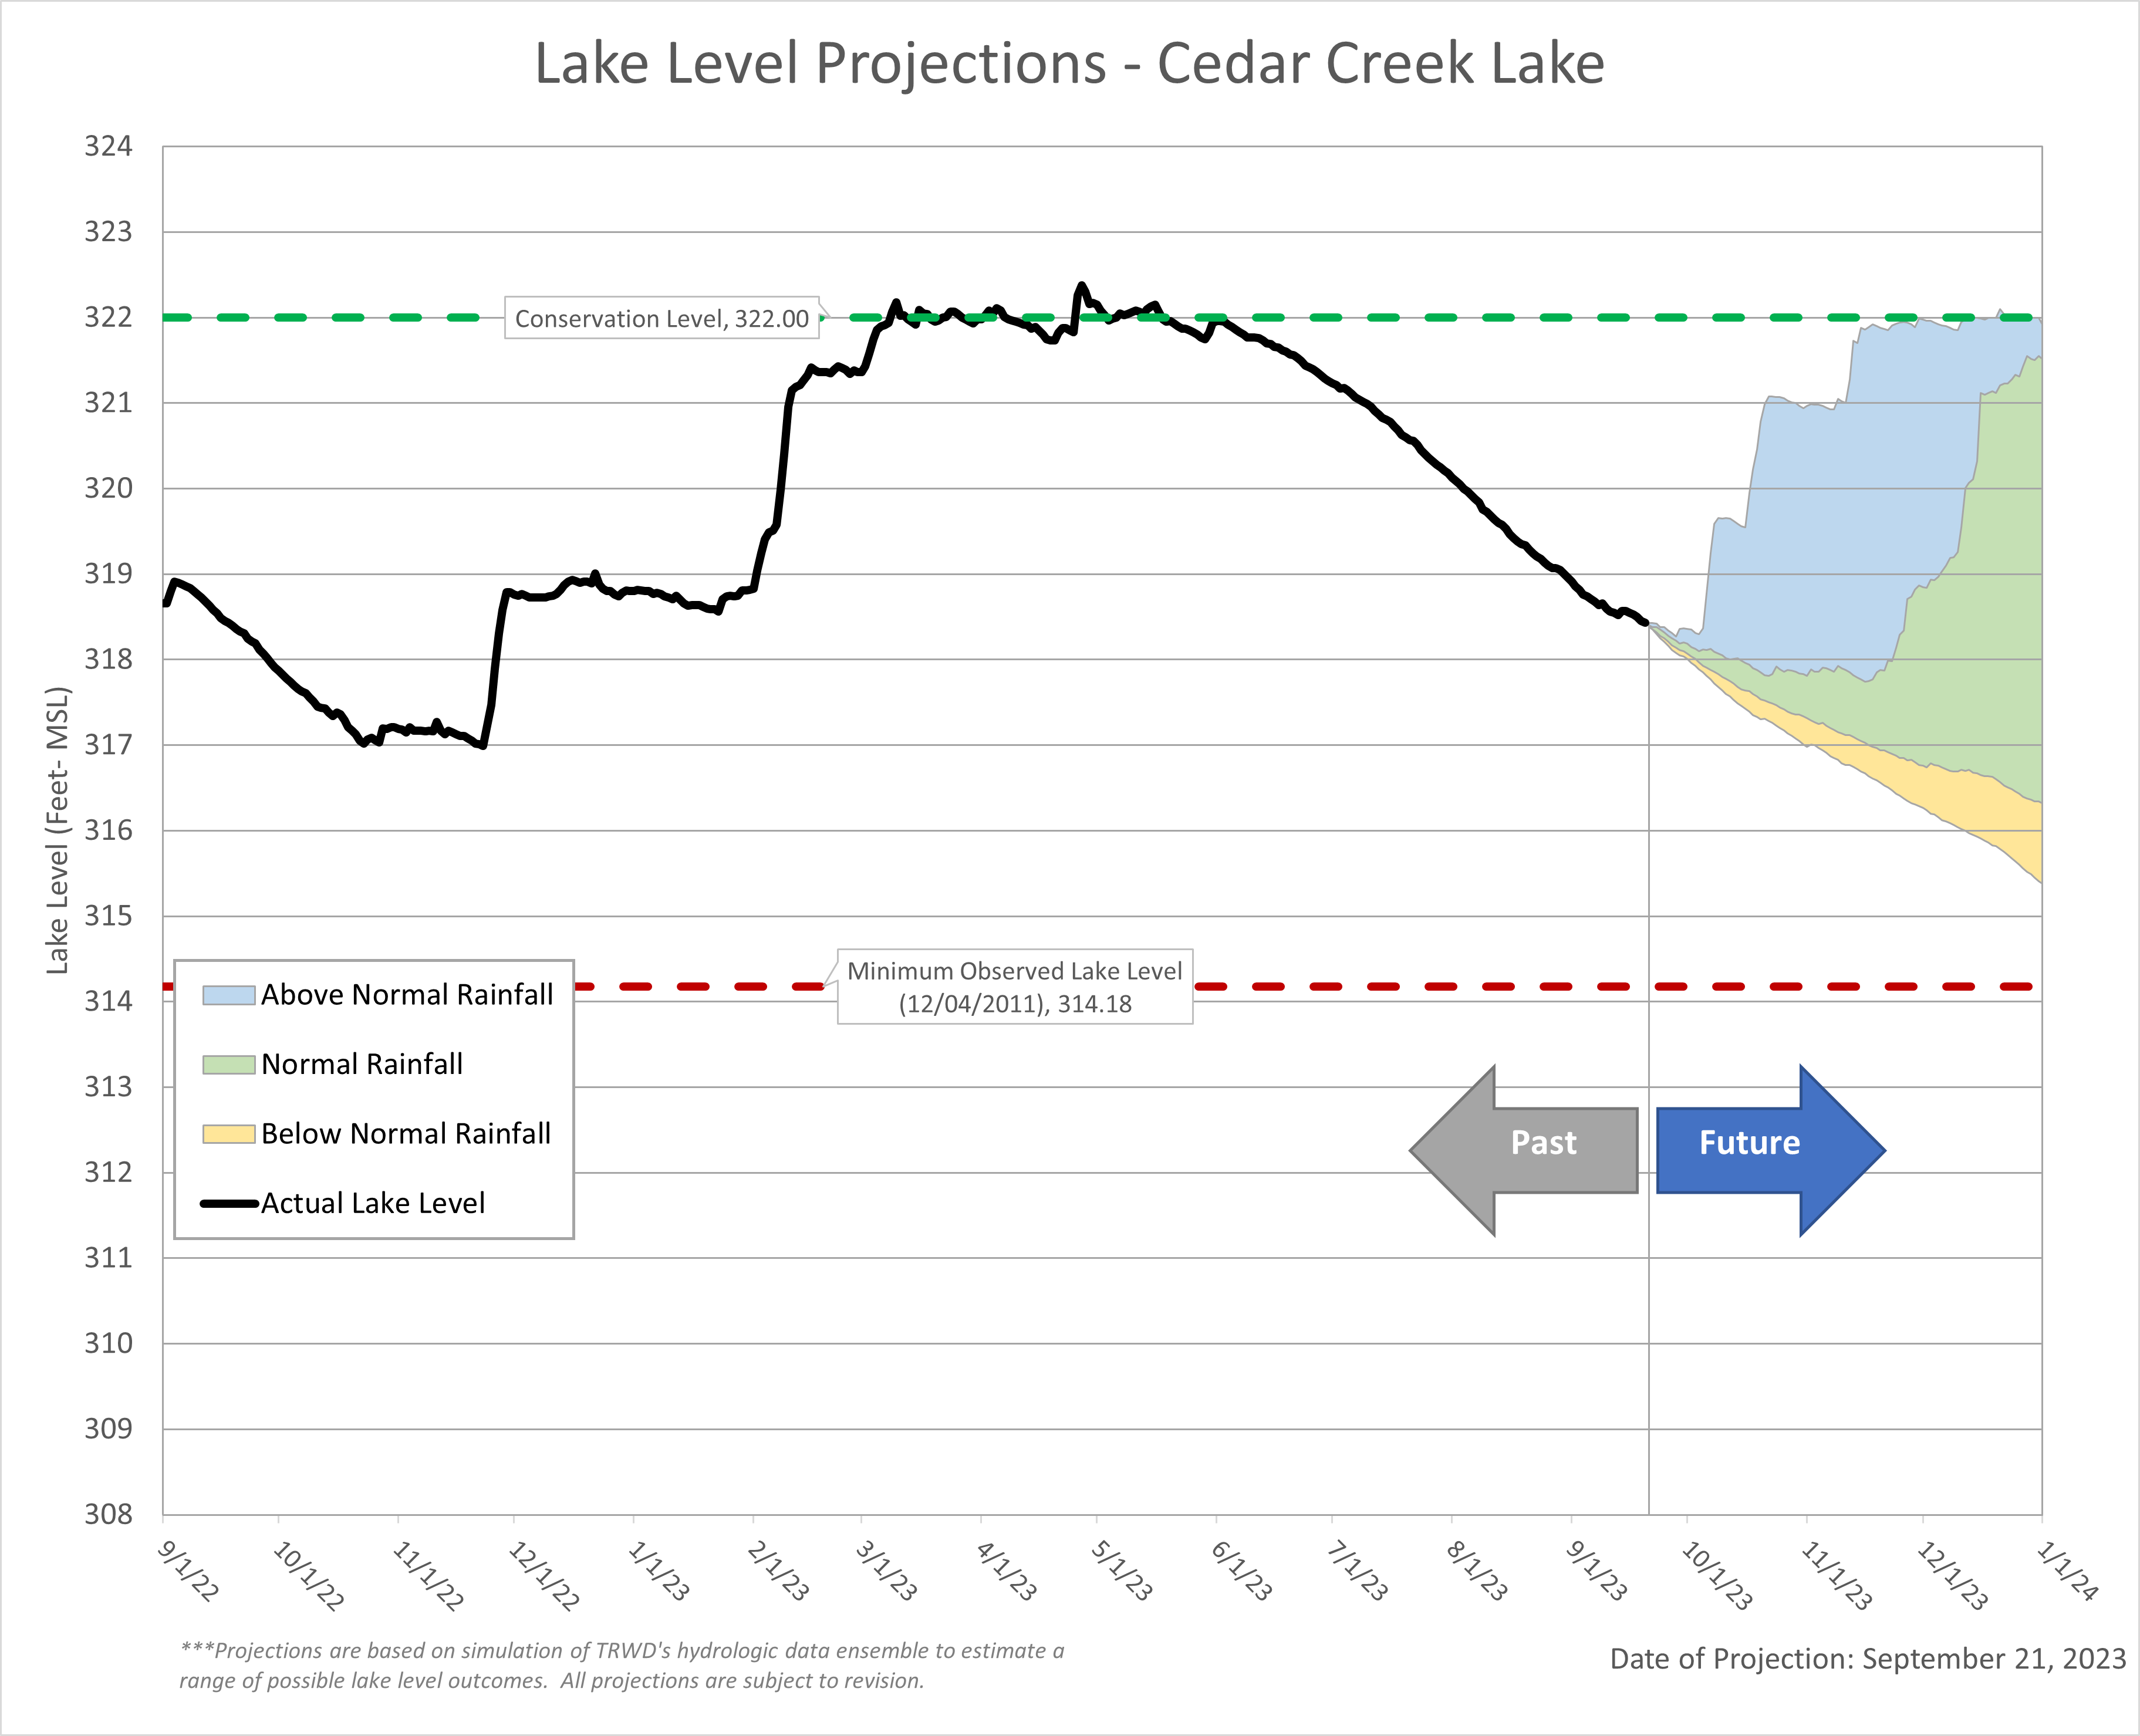
Cedar Creek Lake
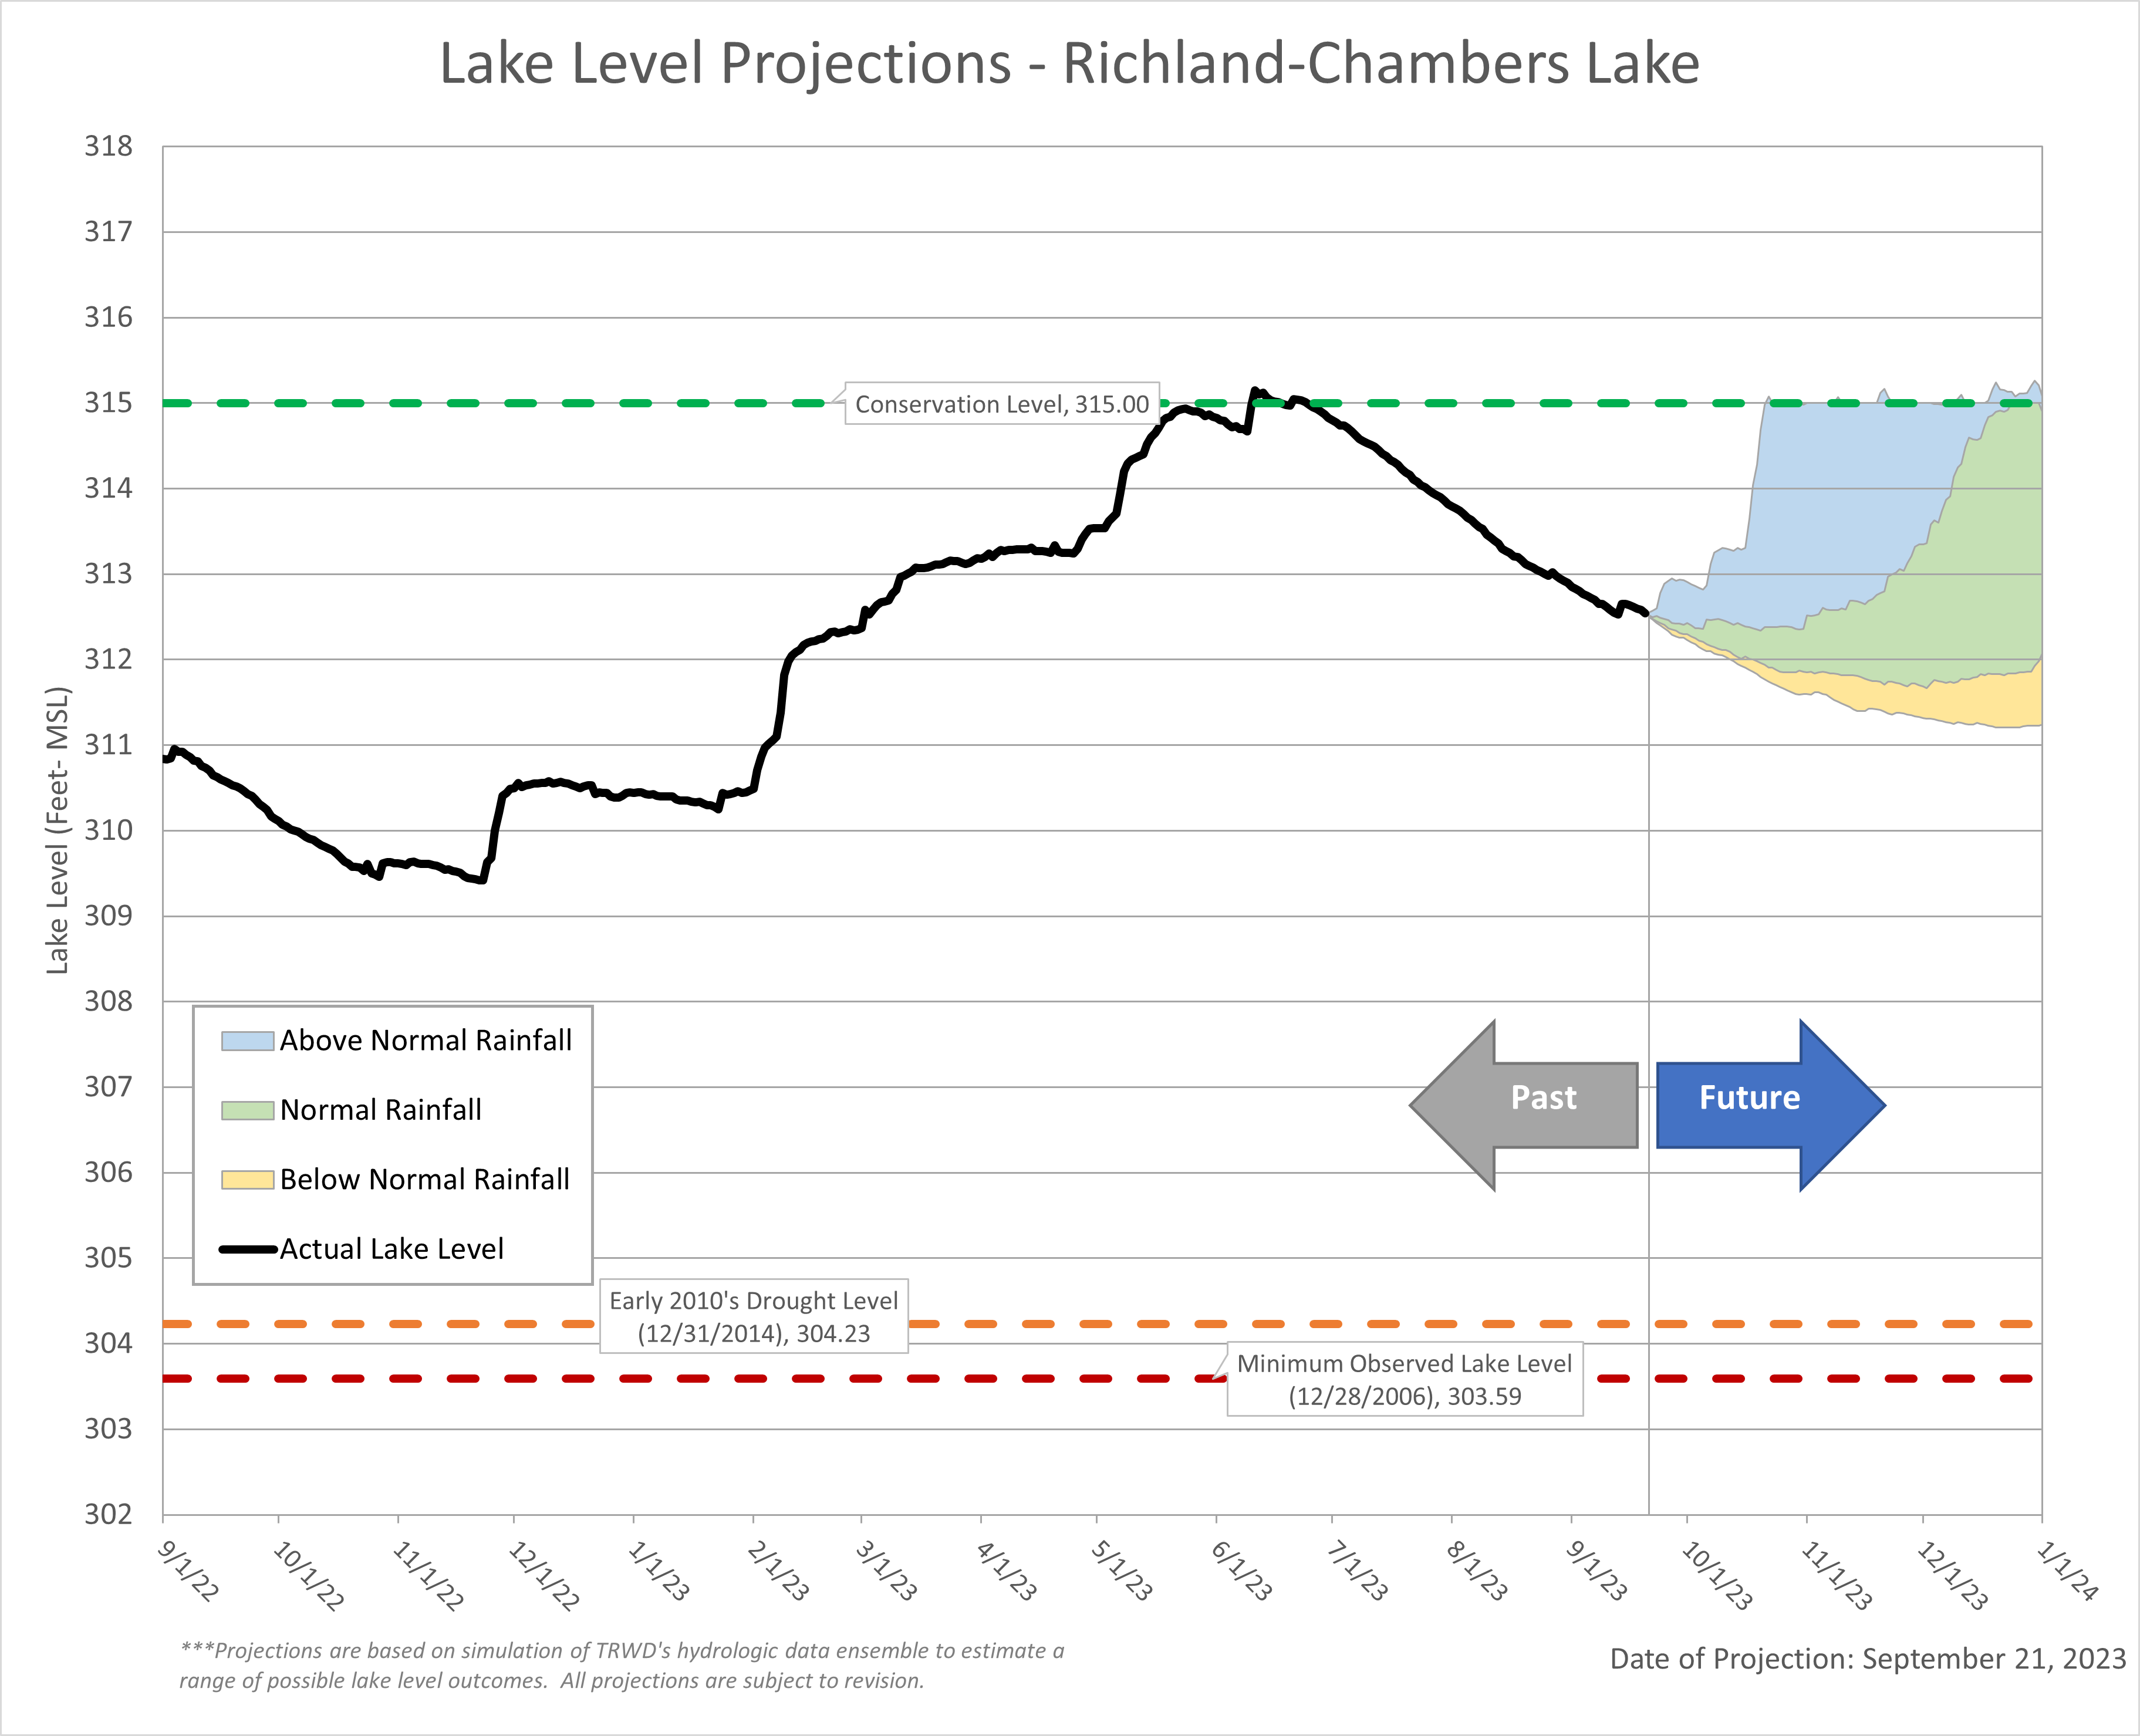
Richland-Chambers Lake