The latest round of lake level projections are shown below. You will also find:
- Links to historical lake level plots
- Last month’s projections compared to what actually happened.
Lake levels are highly influenced by rainfall. It looks like we are finally making the turn towards cooler/wetter conditions. TRWD’s Meteorologist, Courtney Jalbert, provides discussion on what happened in October and where we may be heading in the “From our Meteorologist” section. Thank you for following the Lake Level Blog and check back next month about this time for more projections.
From our Meteorologist
October Summary…
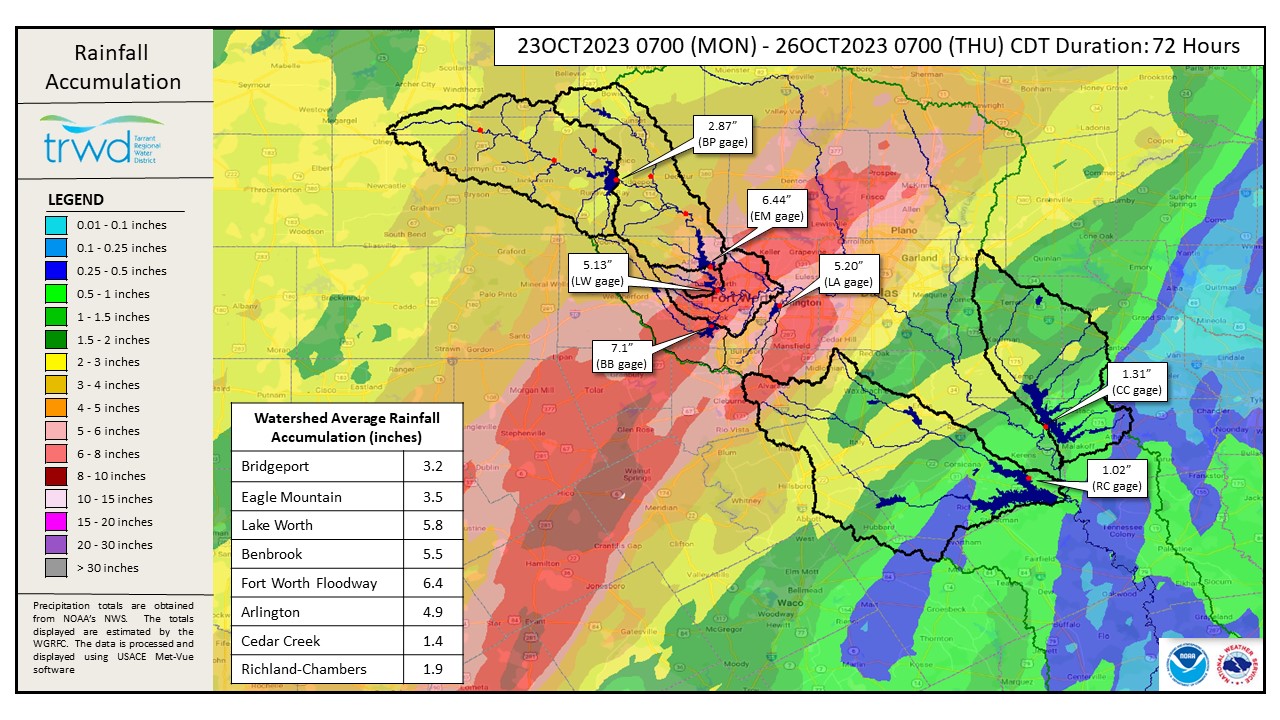
Most of October has been a continuation of the same hot and dry pattern we have been stuck in. As of October 23rd temperatures were a little more than 2˚ warmer than normal and precipitation totals were about a third of the expected normal amount. Keep in mind October is typically the 2nd wettest month of the year behind May. Before the start of this week, DFW Airport year-to-date rainfall total was nearly 16 inches below normal. As of this post, the month of October is 2.48 inches above normal at DFW and the annual deficit has been cut to 9 inches. This is due to recent heavy rainfall shown in the map below.
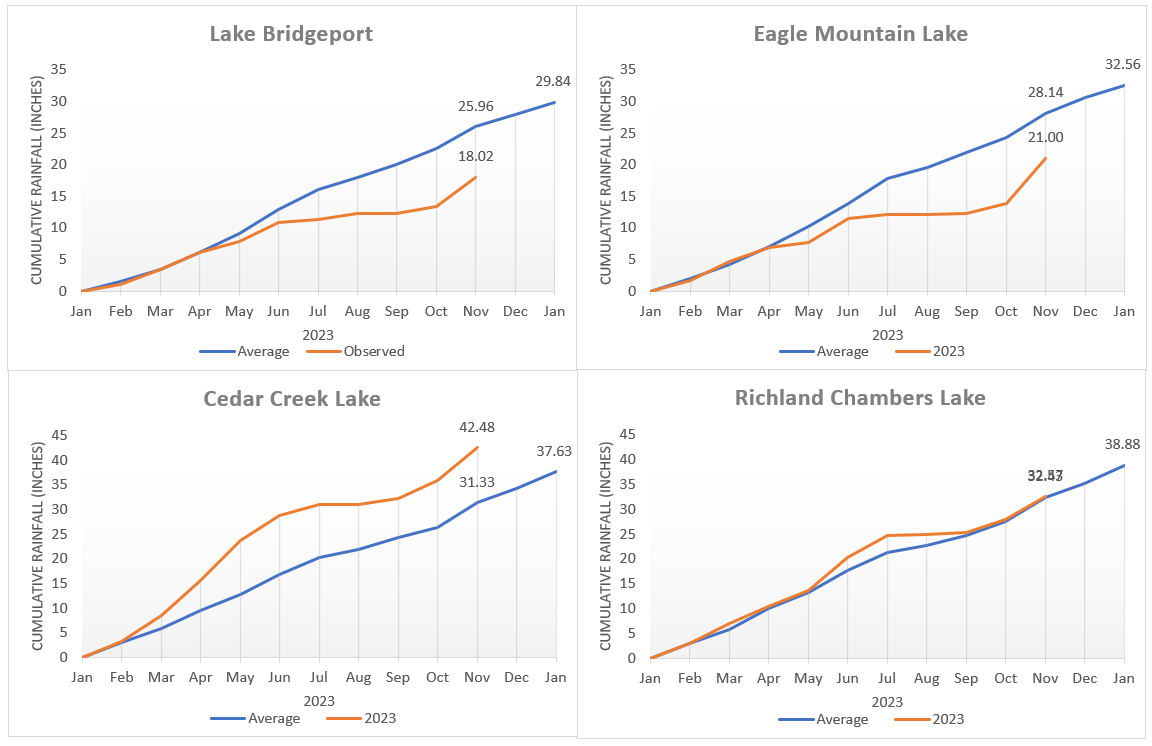
This rainfall increased the total water storage of the TRWD system by 0.7% and increased the Bridgeport + Eagle Mountain combined storage by 1.4%. Year-to-date rainfall totals at the lakes also improved, see below. Bridgeport and Eagle Mountain were 9.3 and 10.5 inches below normal but have improved to 7.9 and 7.1 inches, respectively. Richland-Chambers remains near normal and Cedar Creek remains above normal for the year. Keep reading for more on a possible continuation of the wet pattern.
TRWD Lake Rainfall Totals though October 27, 2023
 Looking ahead…
Looking ahead…
The Climate Predication Center expects an above normal precipitation trend to continue over the month of November and extend through early 2024. El Nino should keep influencing our weather more favorably by shifting the location and strength of the jet stream through the winter months. Typically, an El Nino in the Pacific means a wetter pattern across the southern part of the United States due to that shift. El Nino has a greater than 80% chance of extending into March through May of 2024. A higher chance of above normal precipitation is good news for North Texas, but the deficits experienced over the last year will take time to recover.
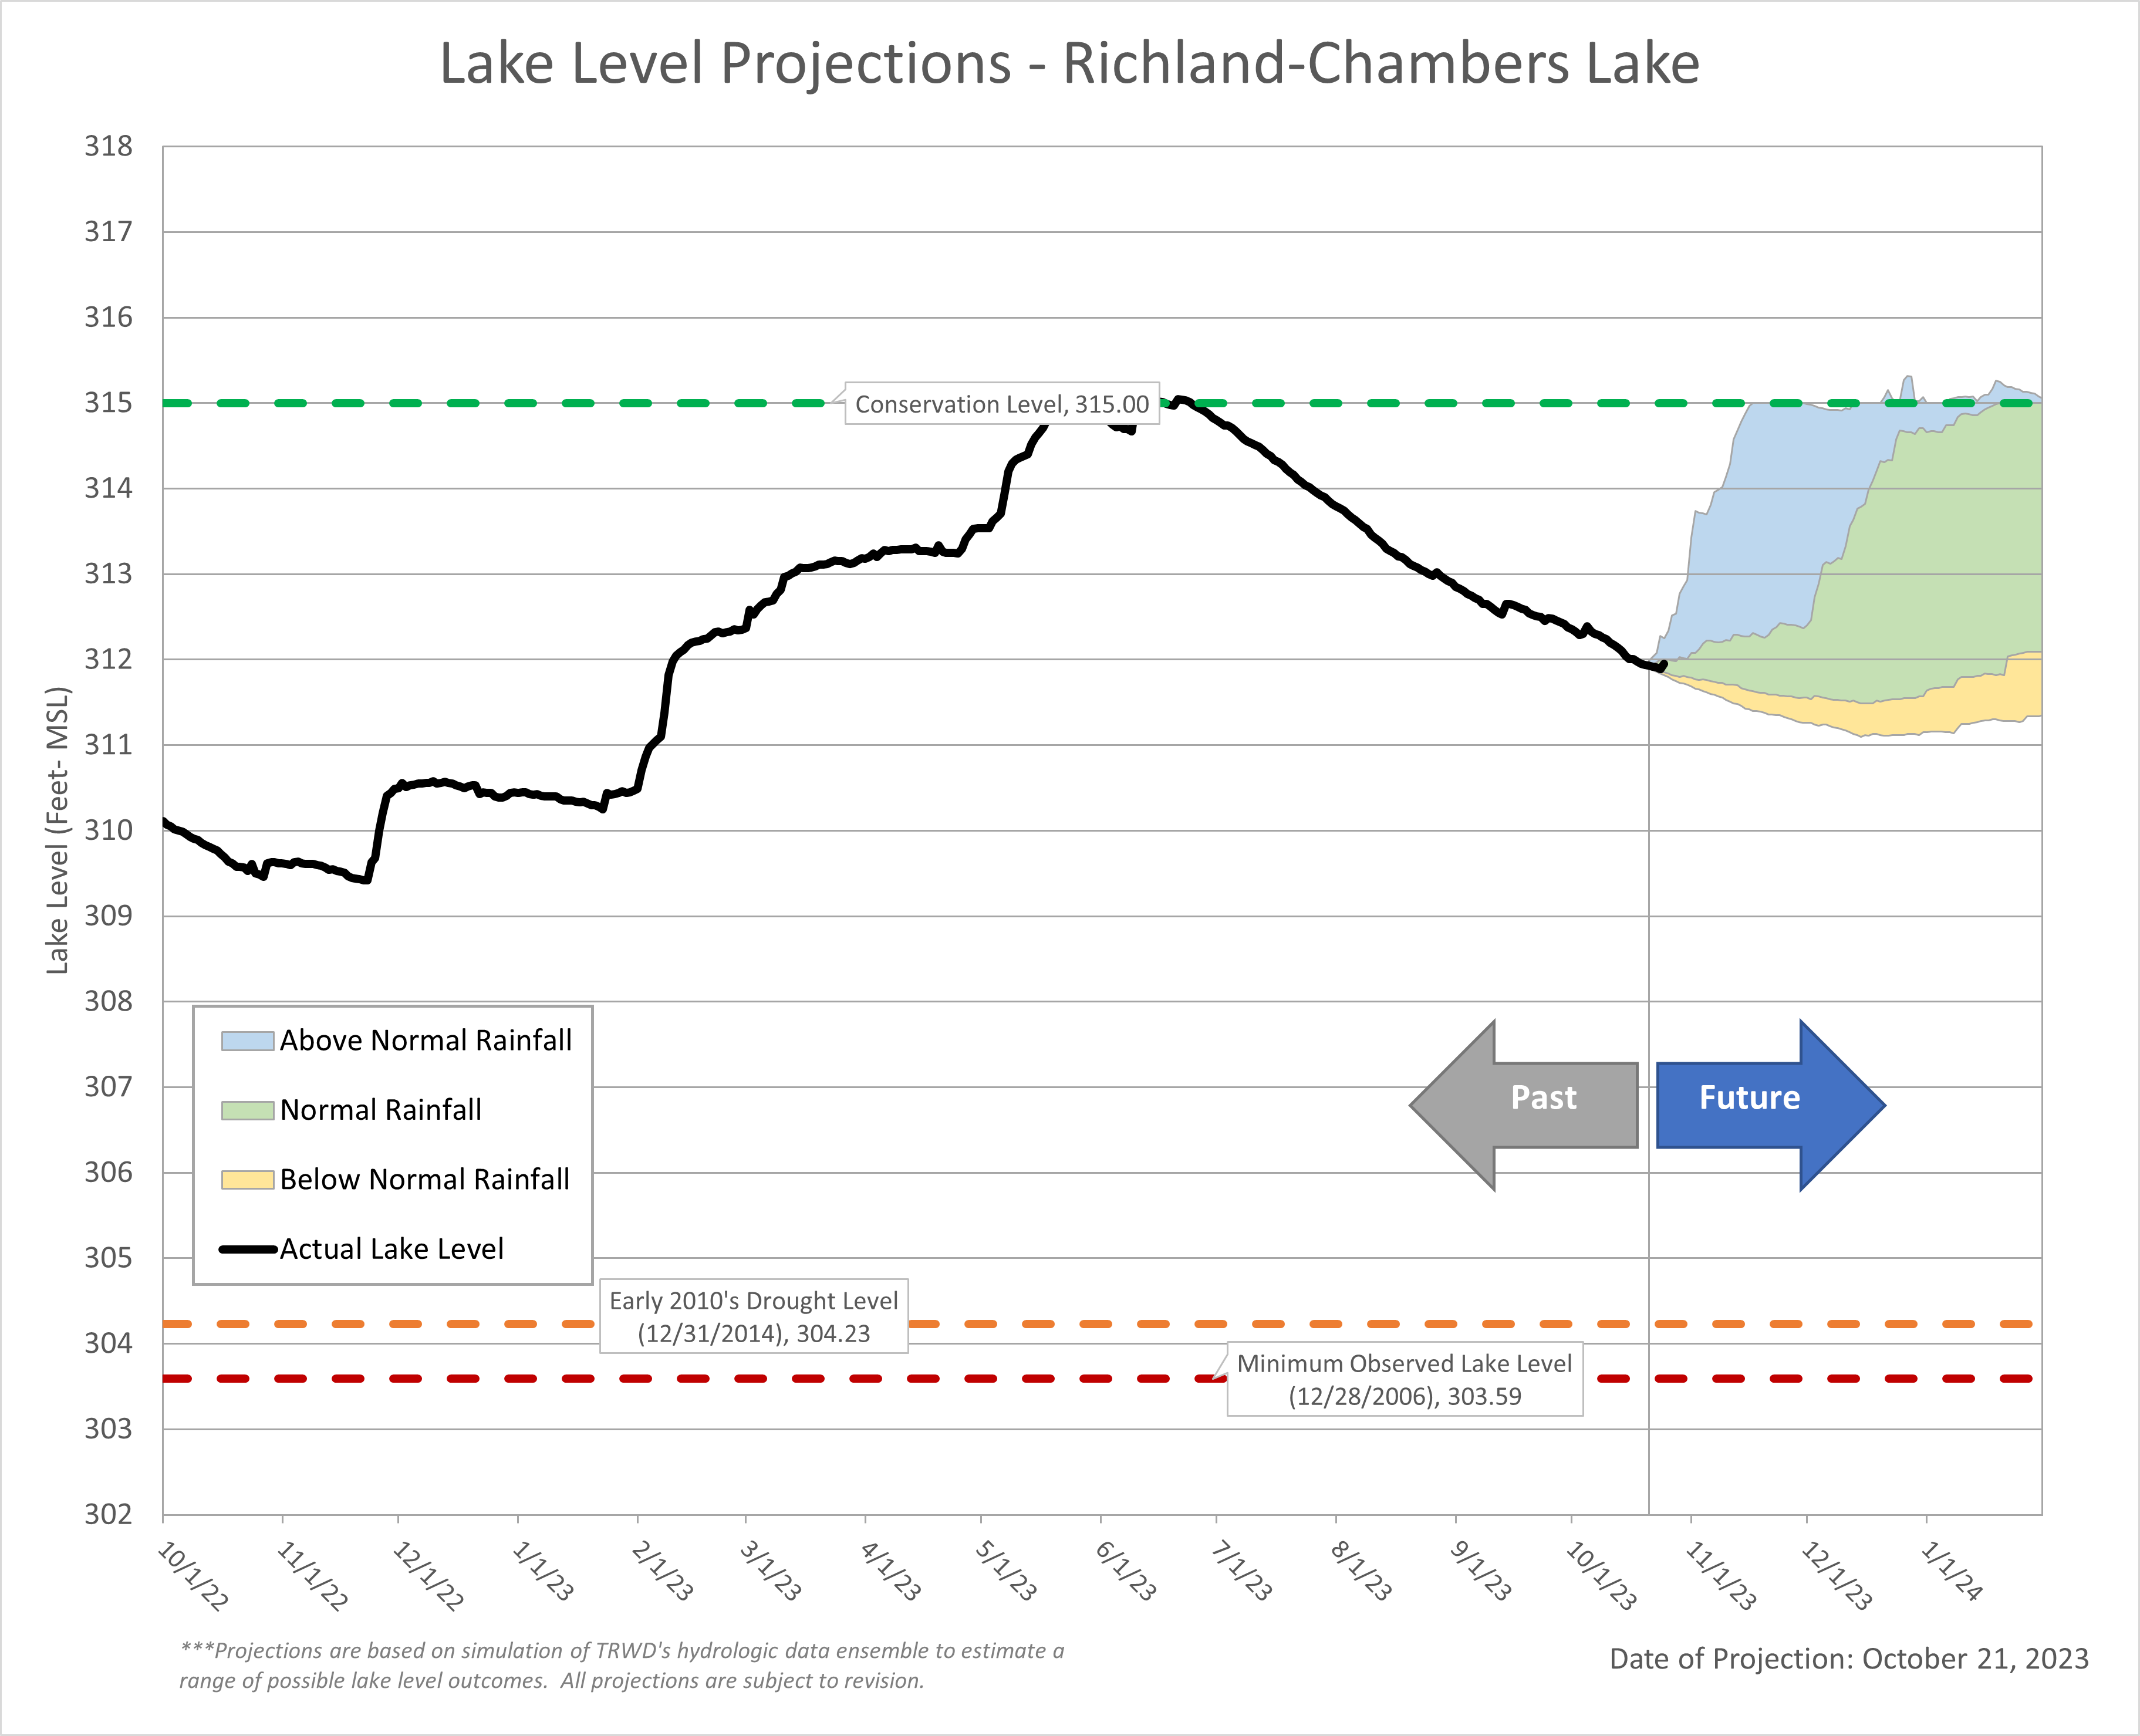
Projections
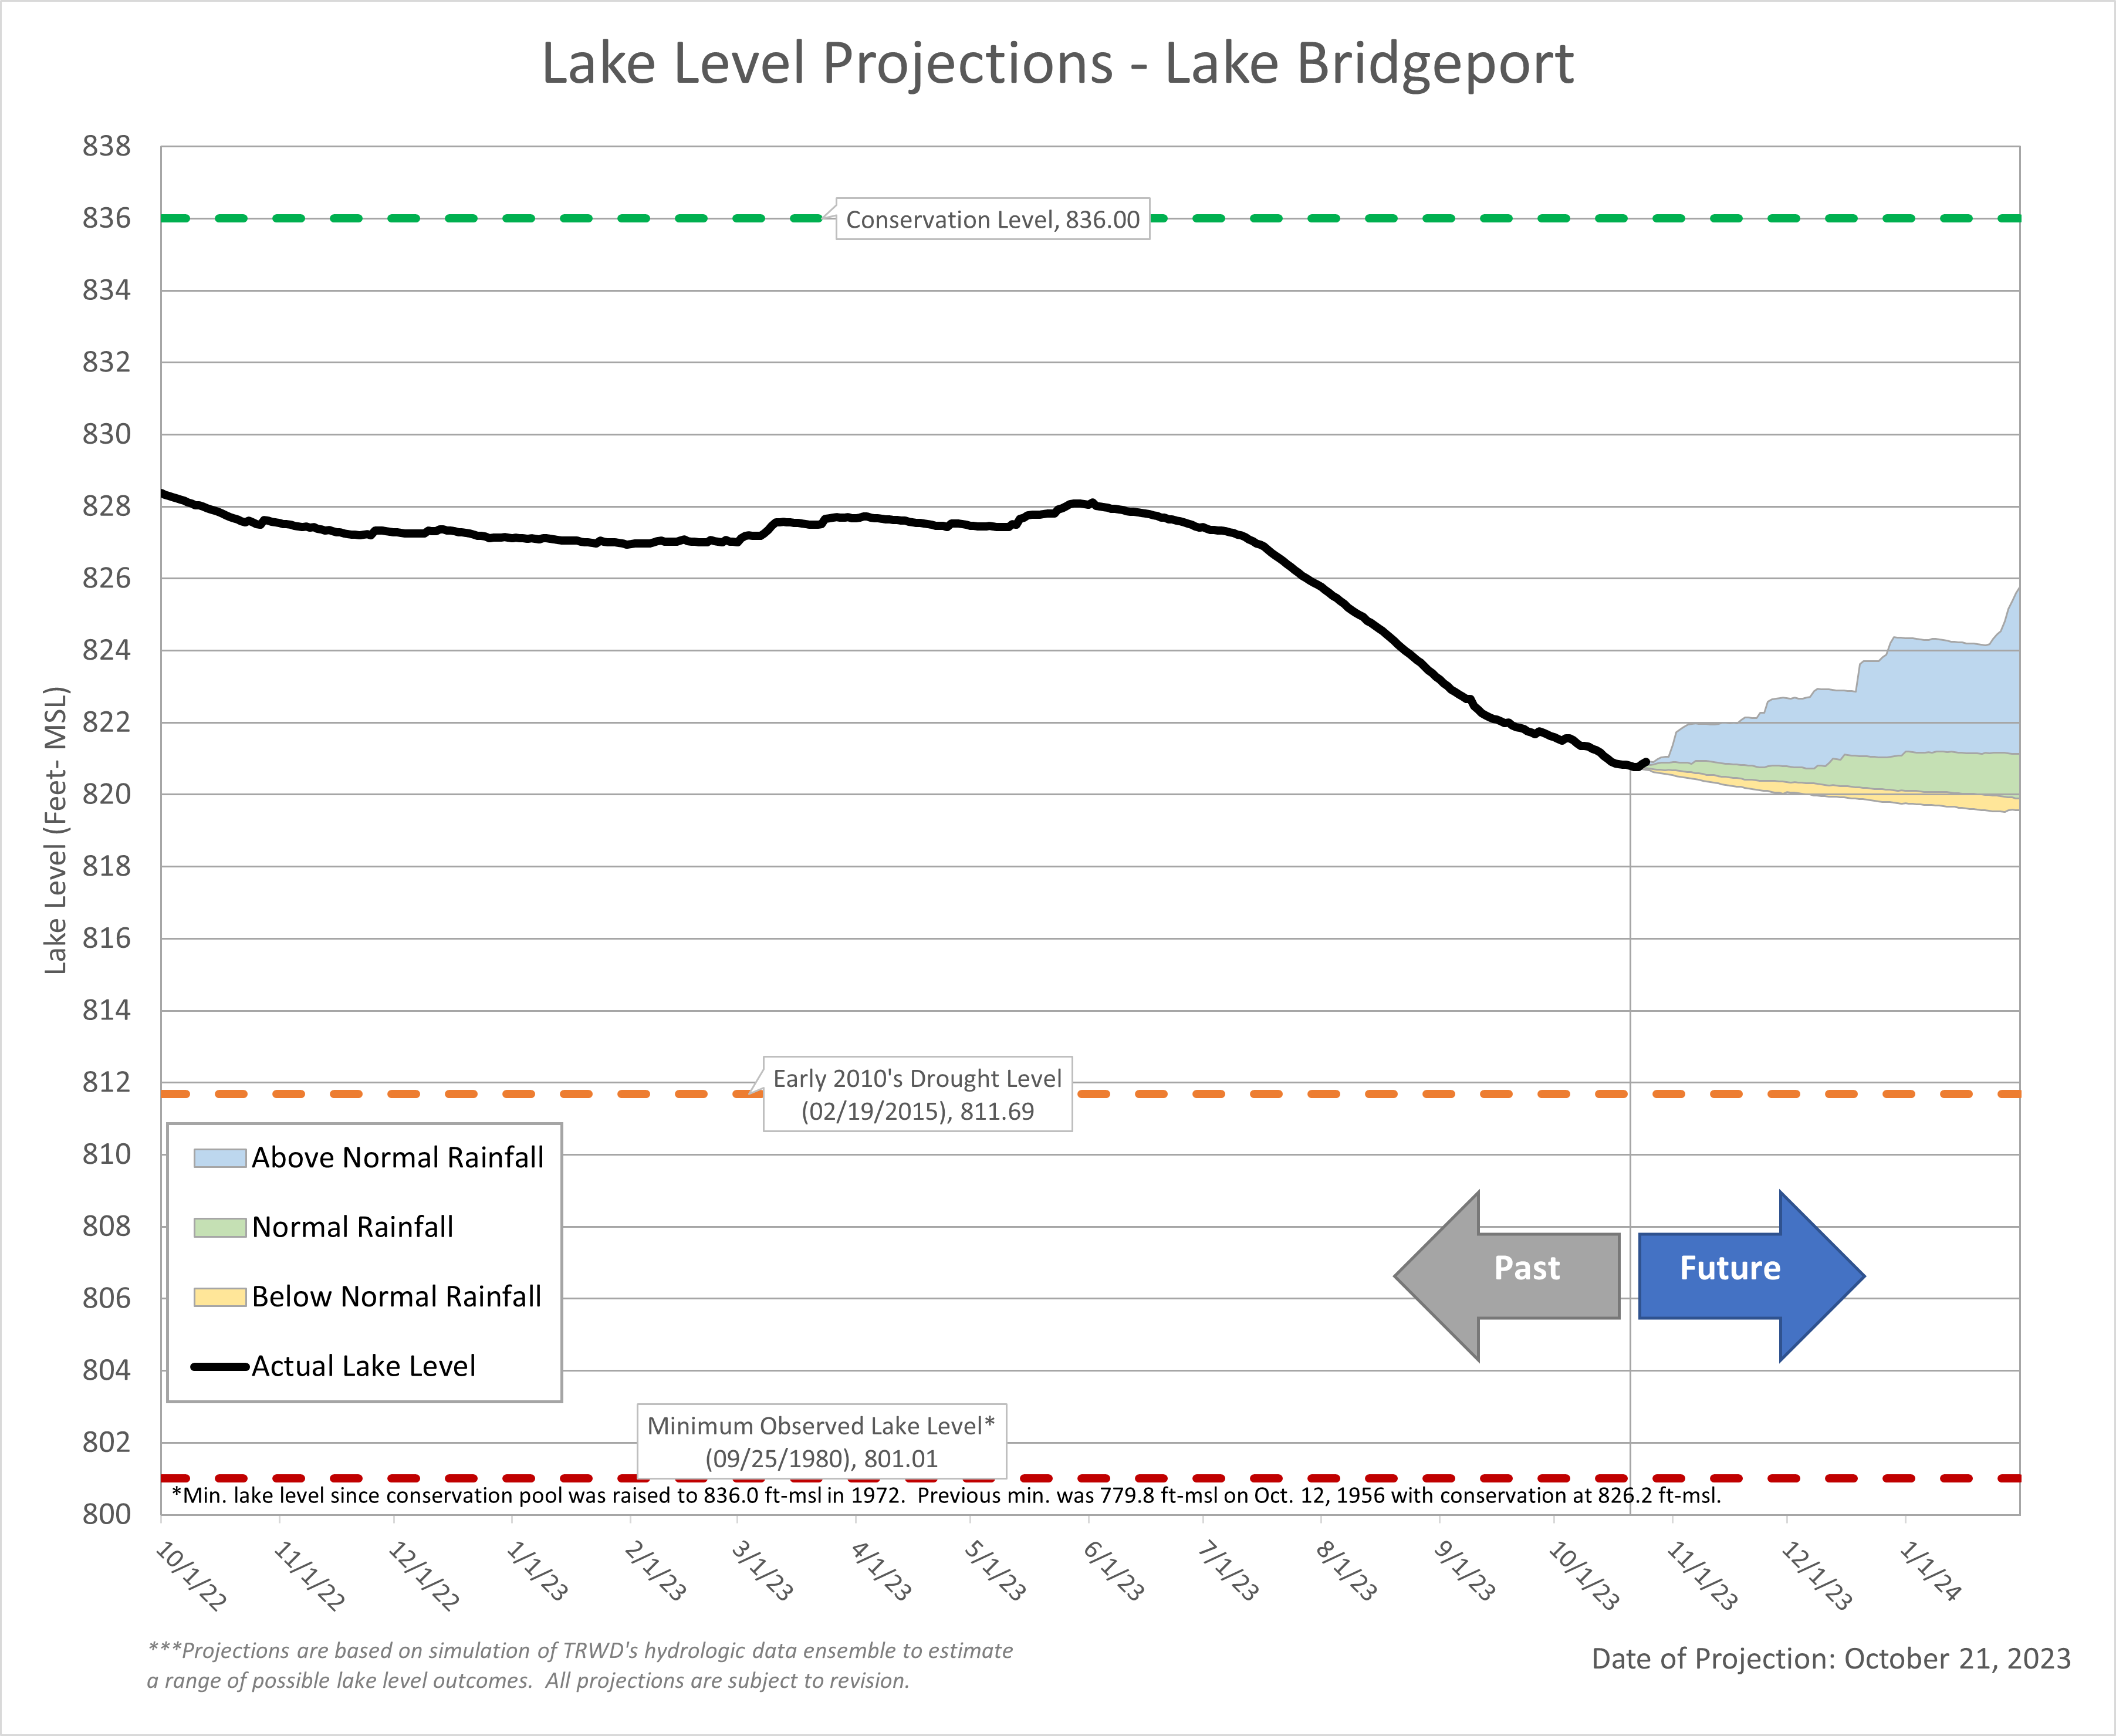
Lake Bridgeport
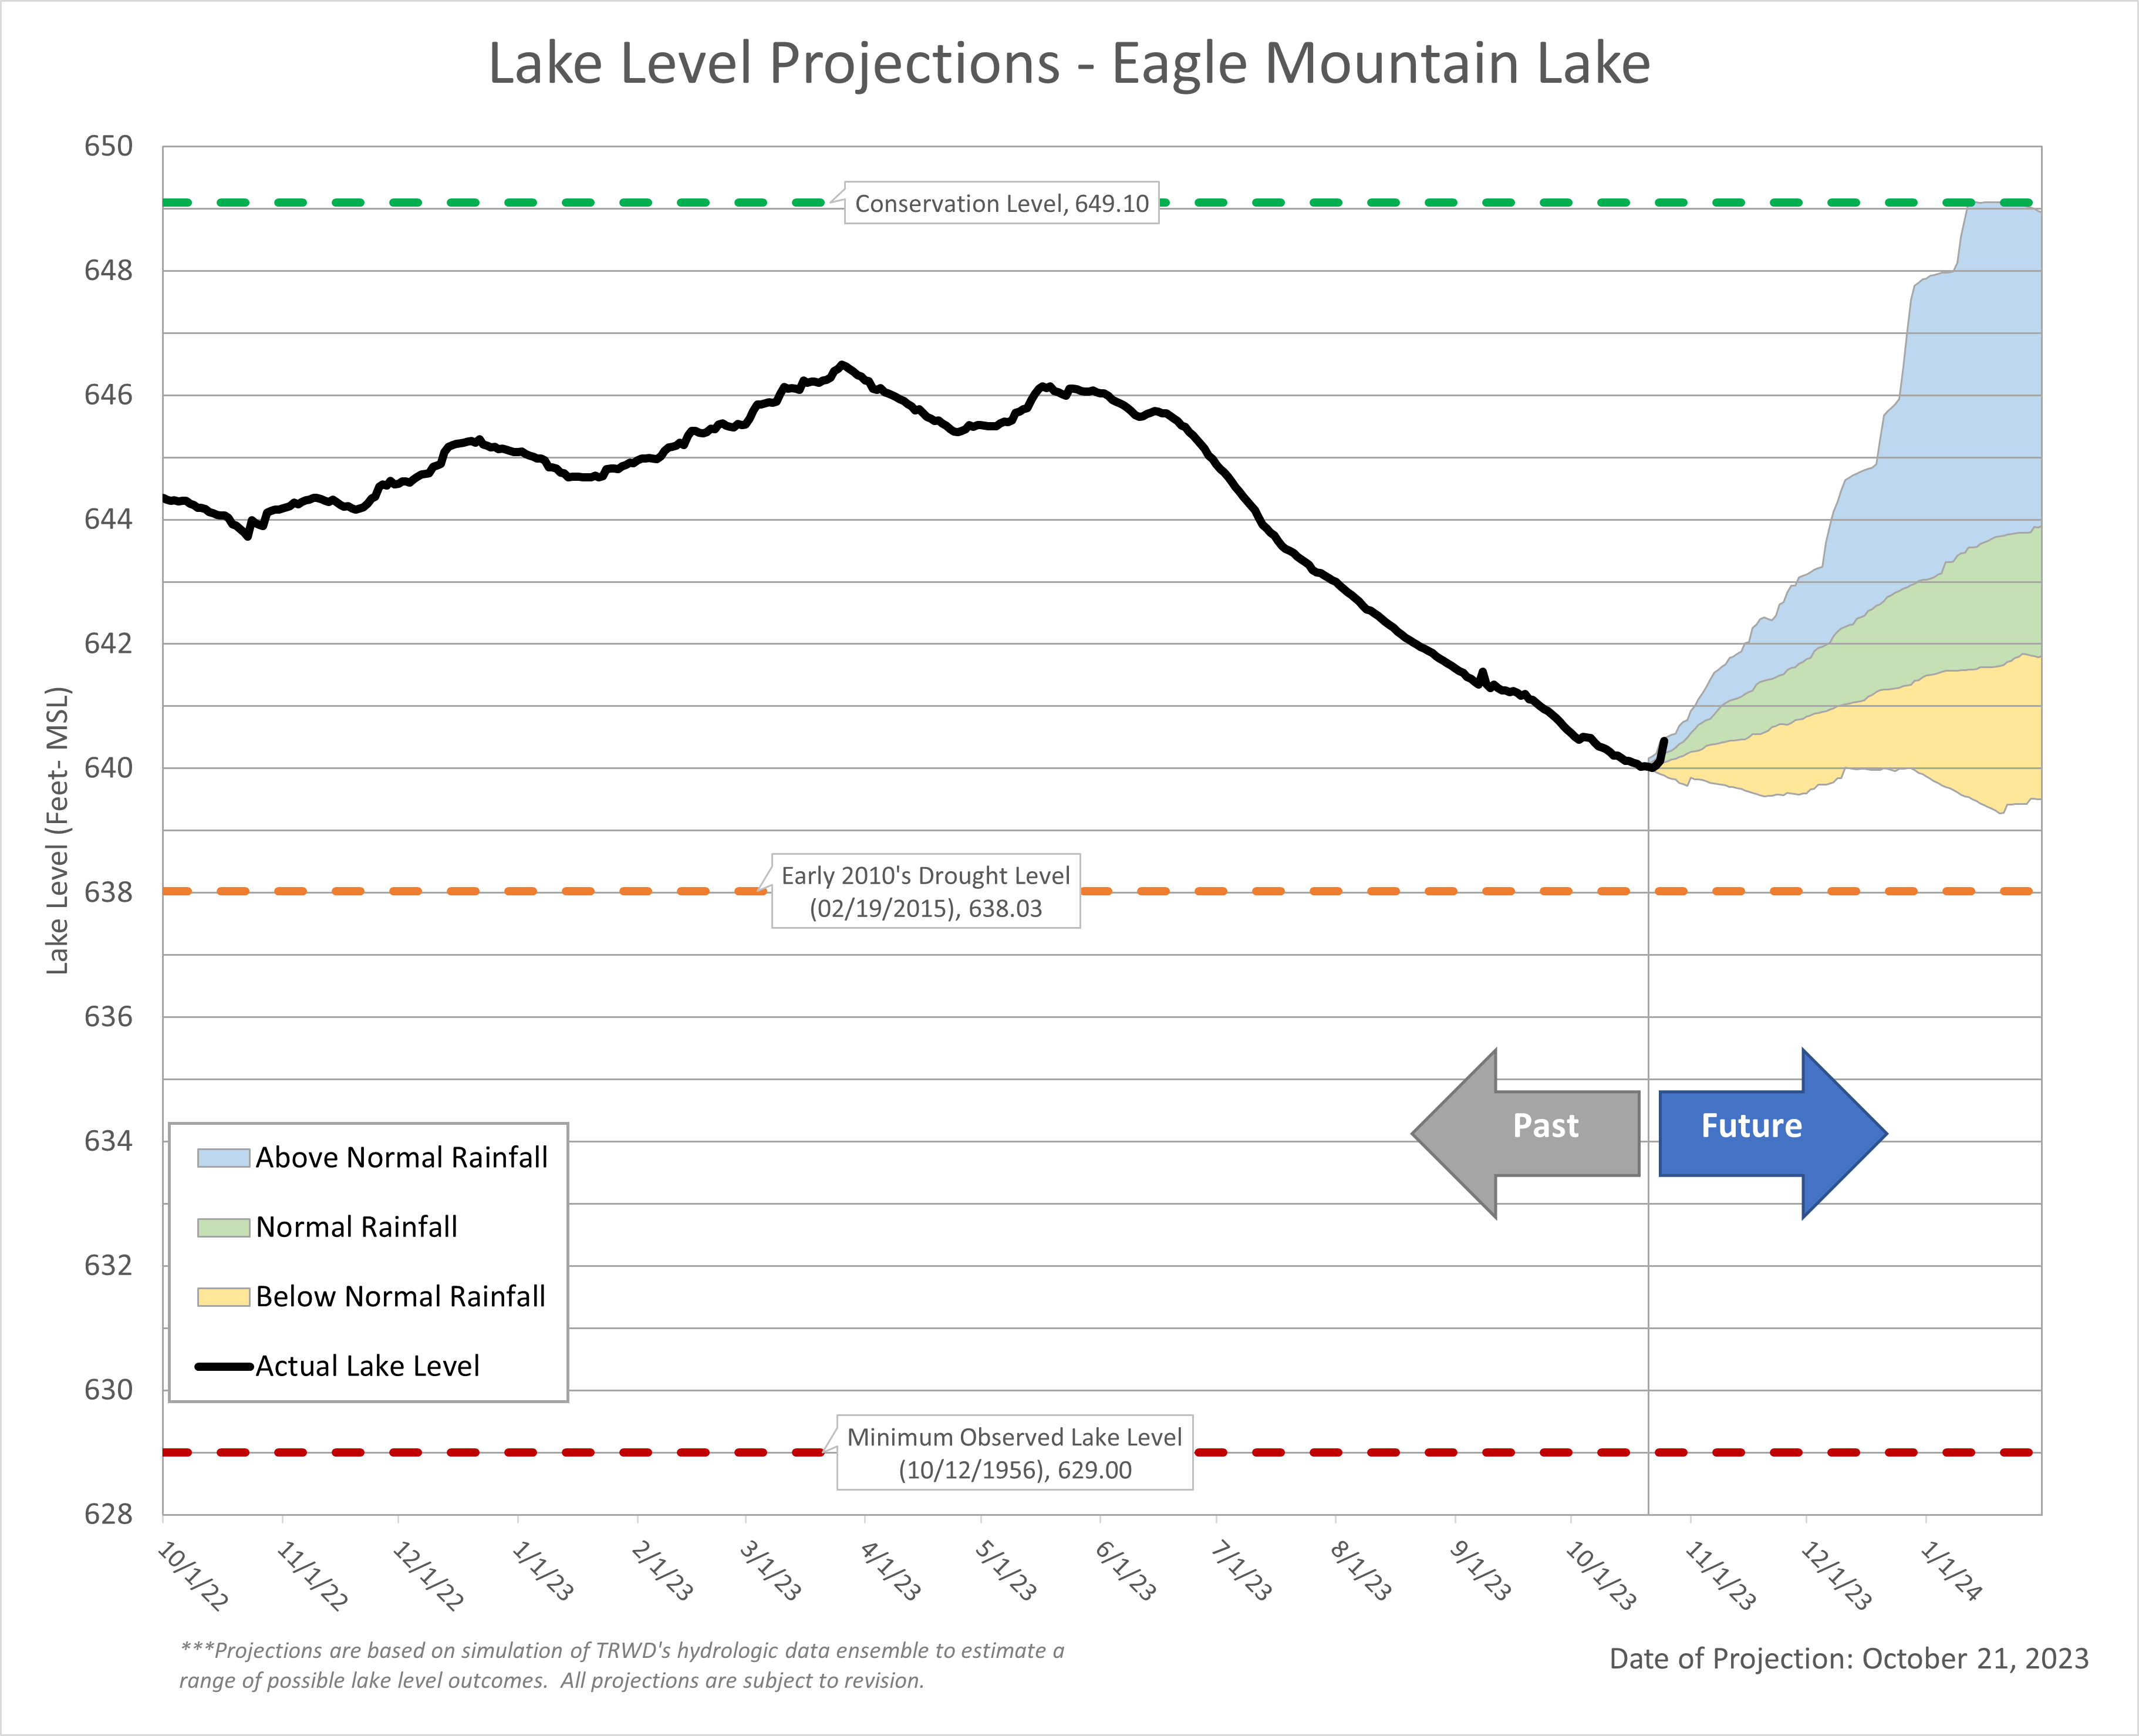
Eagle Mountain Lake
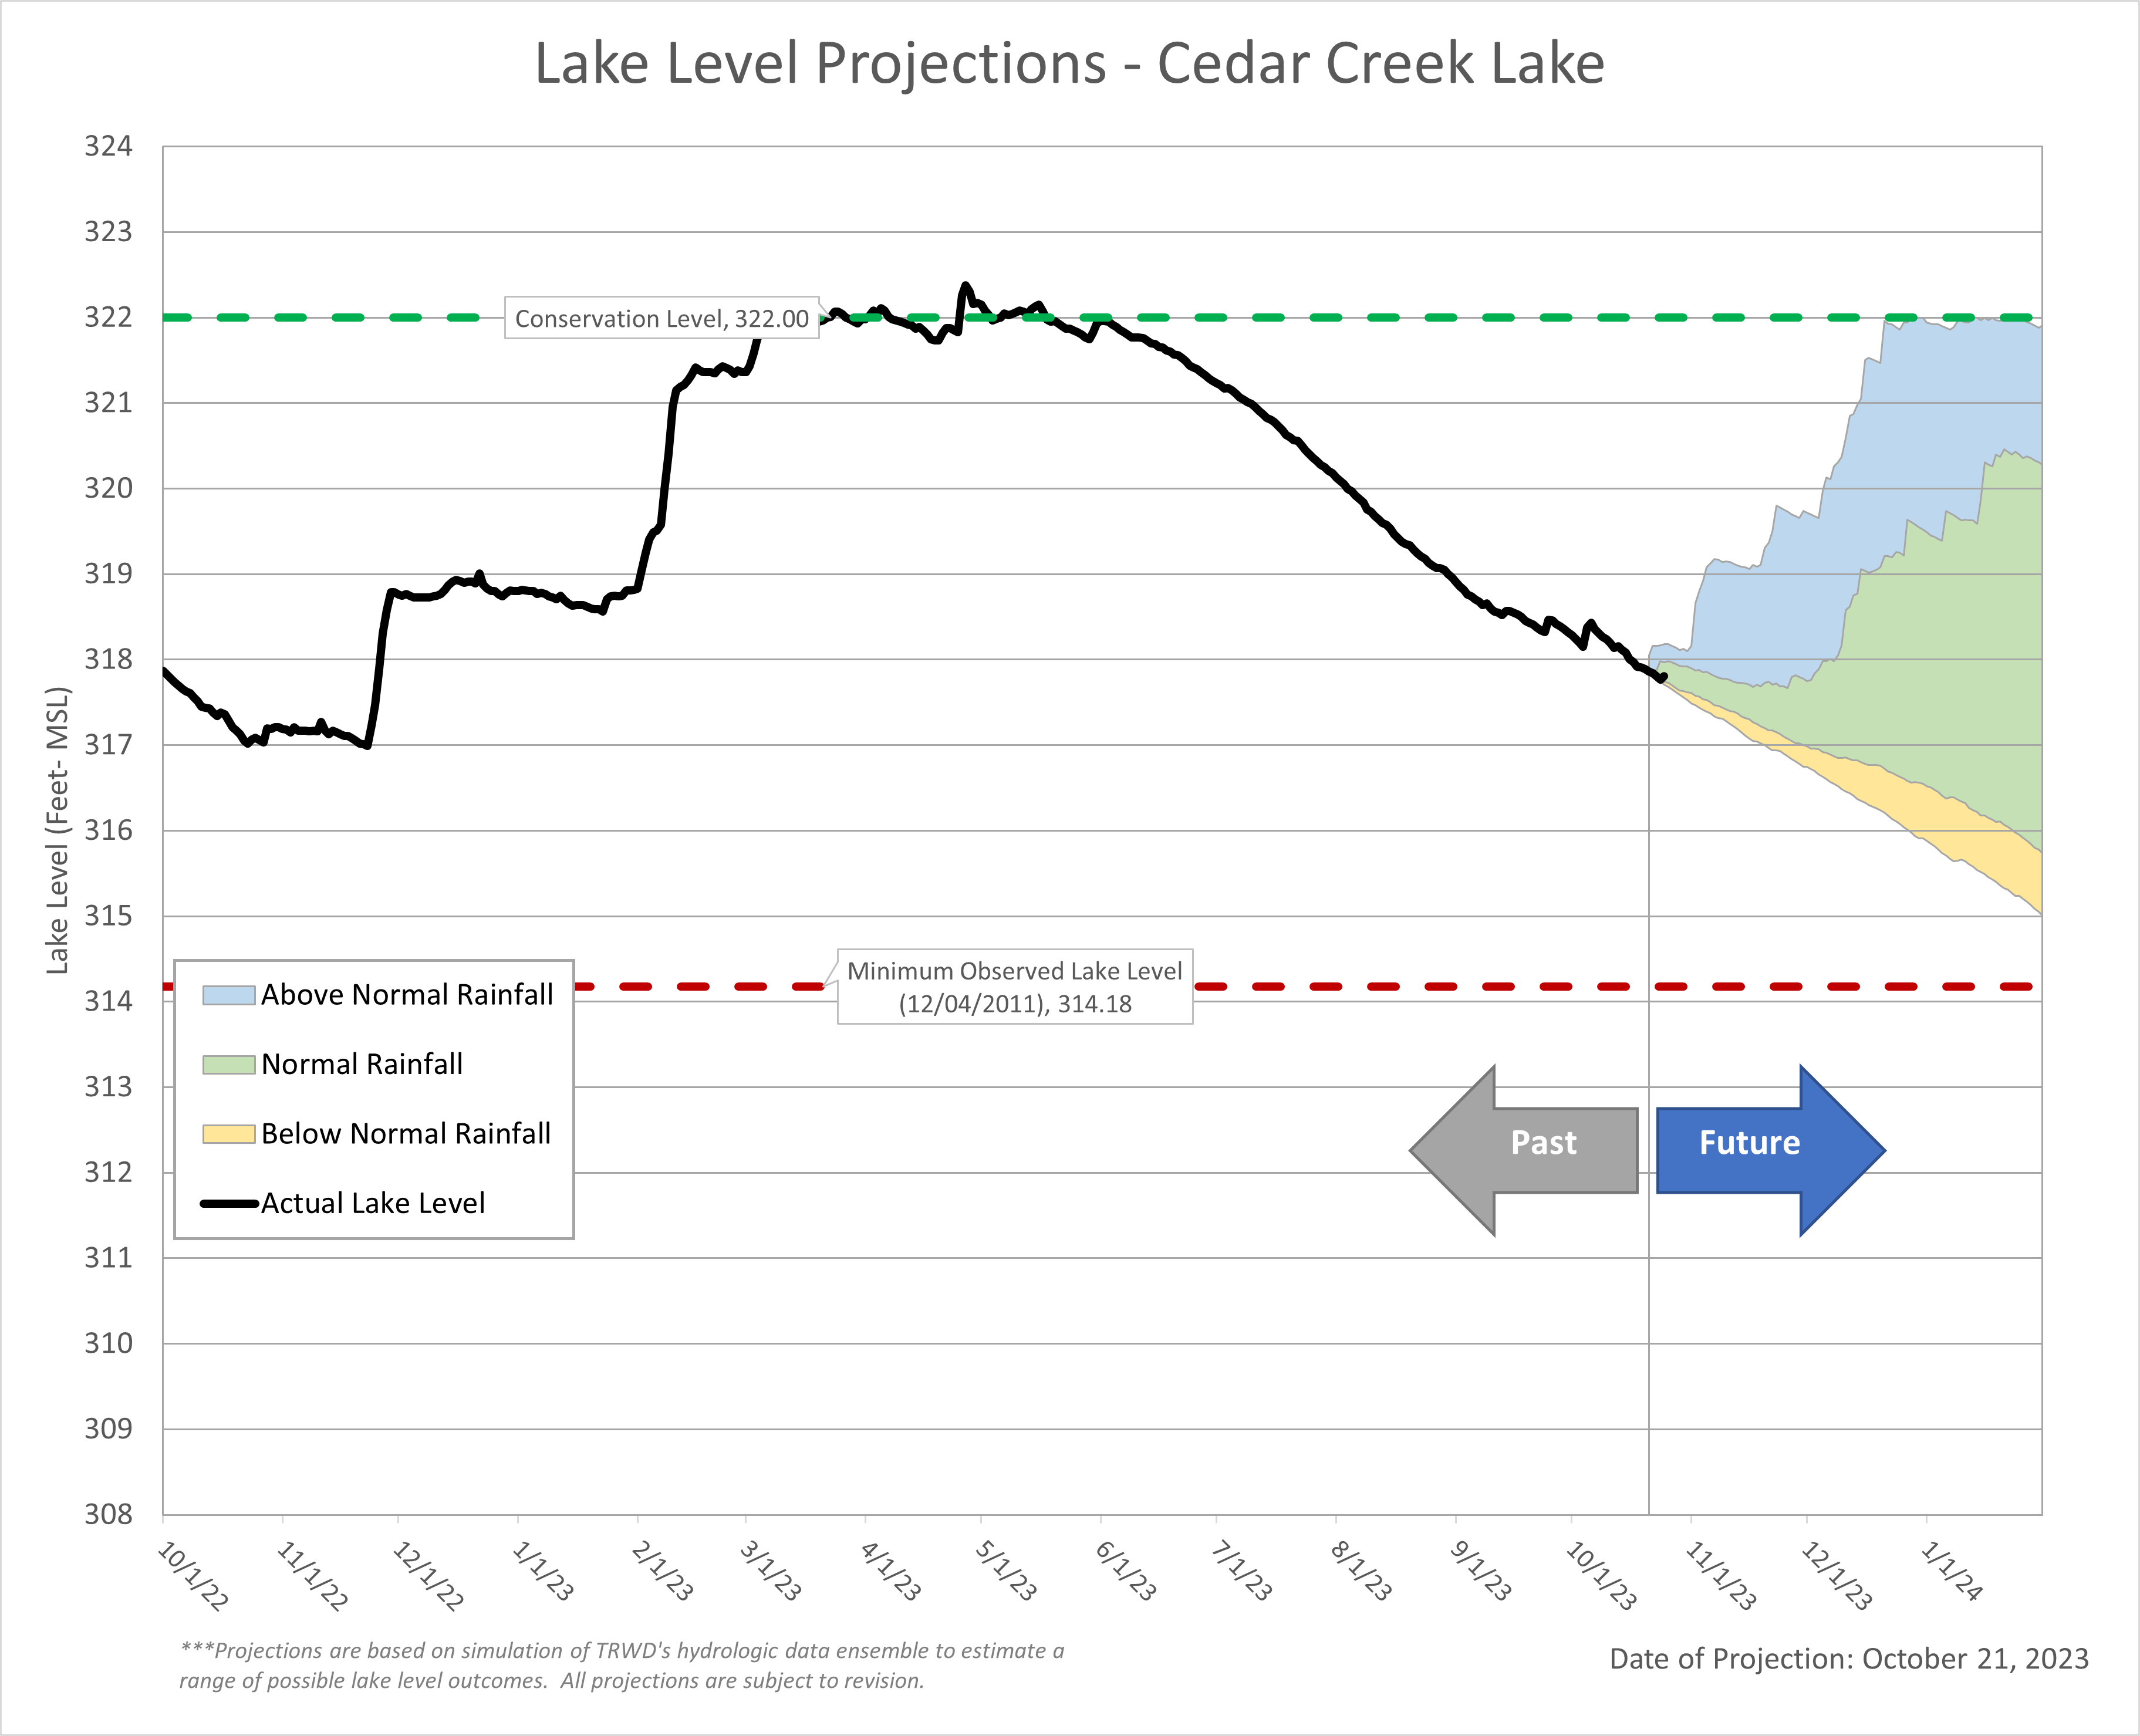
Cedar Creek Lake
Richland-Chambers Lake