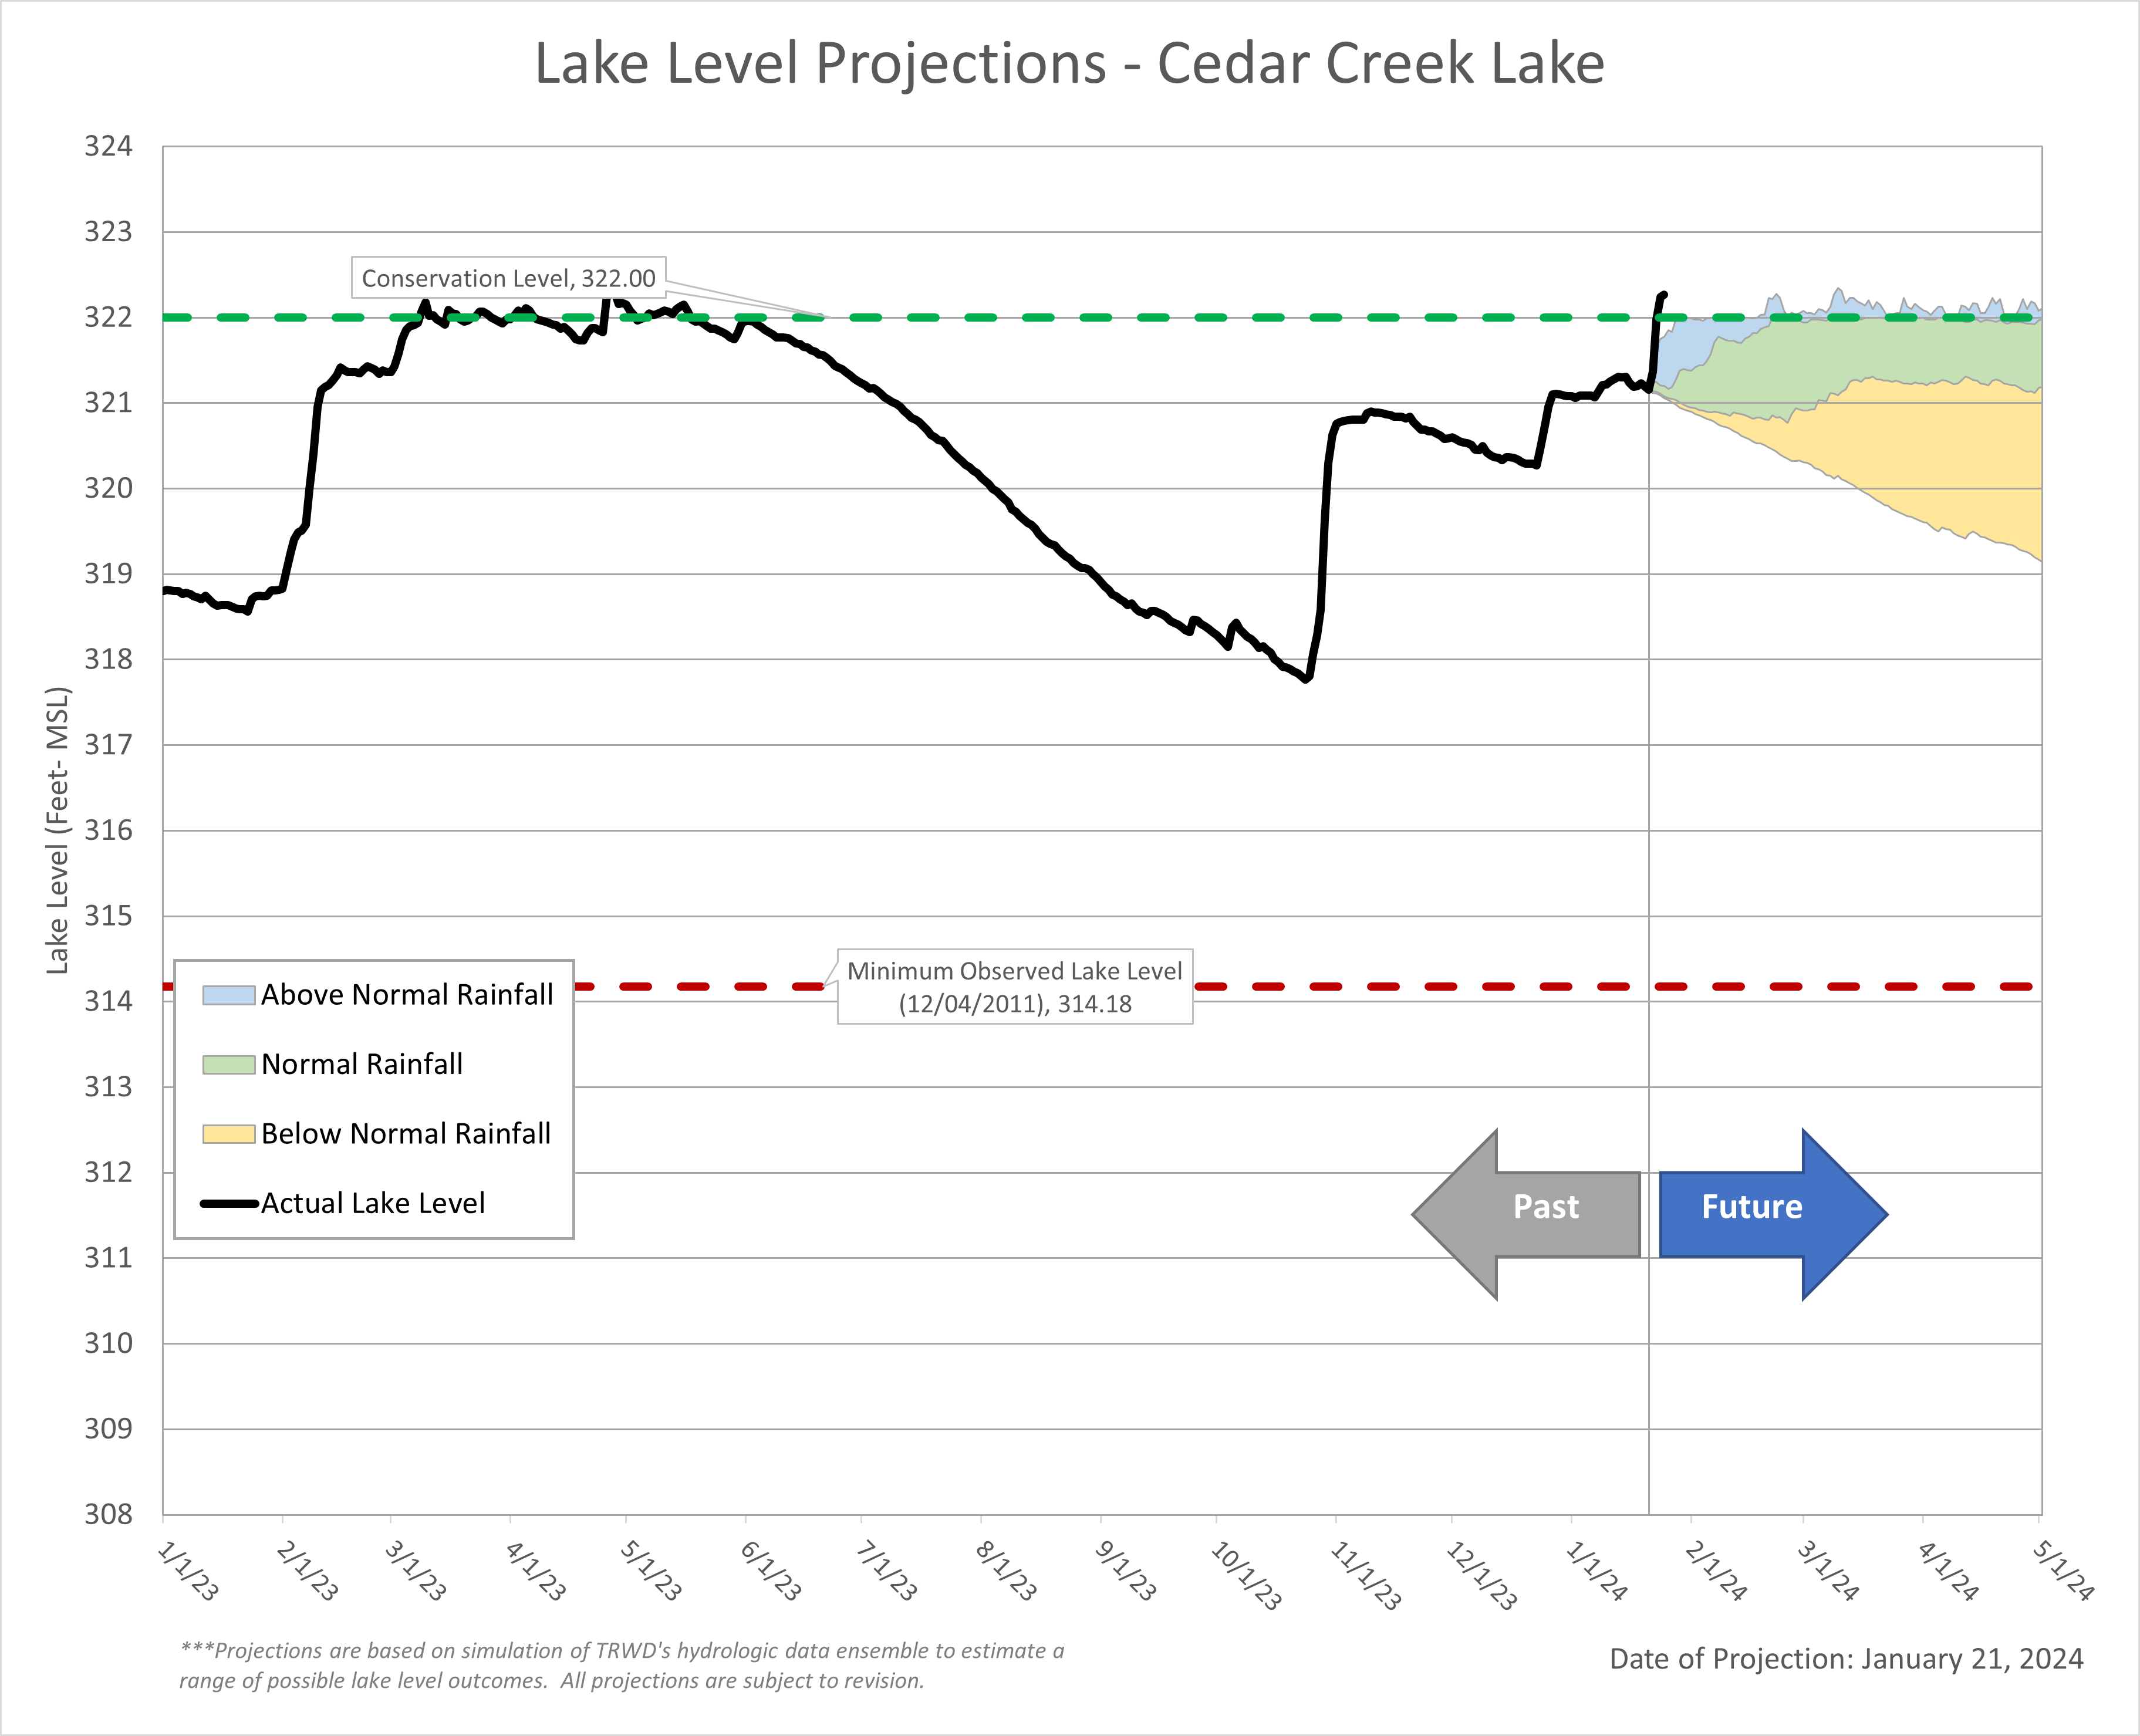
The latest lake level projections are shown below. You will also find:
- Links to historical lake level plots
- Last month’s projections compared to what actually happened
The increased rain chances, due to El Nino’s influence, paired with high run off potential in the watersheds, due to cooler temperatures and dormant vegetation suggests an increasing trend in system storage going forward. TRWD’s Meteorologist, Courtney Jalbert, provides discussion on what we can expect in terms of rainfall adding water to the lakes in the “From our Meteorologist” section. Thank you for following the Lake Level Blog and check back next month about this time for more projections.
From our Meteorologist
January Summary…
January has been colder and wetter than average. As of January 25th, at DFW Airport, the average monthly temperature is 5.5° below normal at 40.5° and the monthly rainfall total is 0.36 inches above normal at 2.44 inches. For East Texas, January has been an extremely wet month and some areas have seen 150 to 300% of their normal precipitation over the last 30 days, see 30-Day Rainfall Map and TRWD Lake Rainfall Totals below.
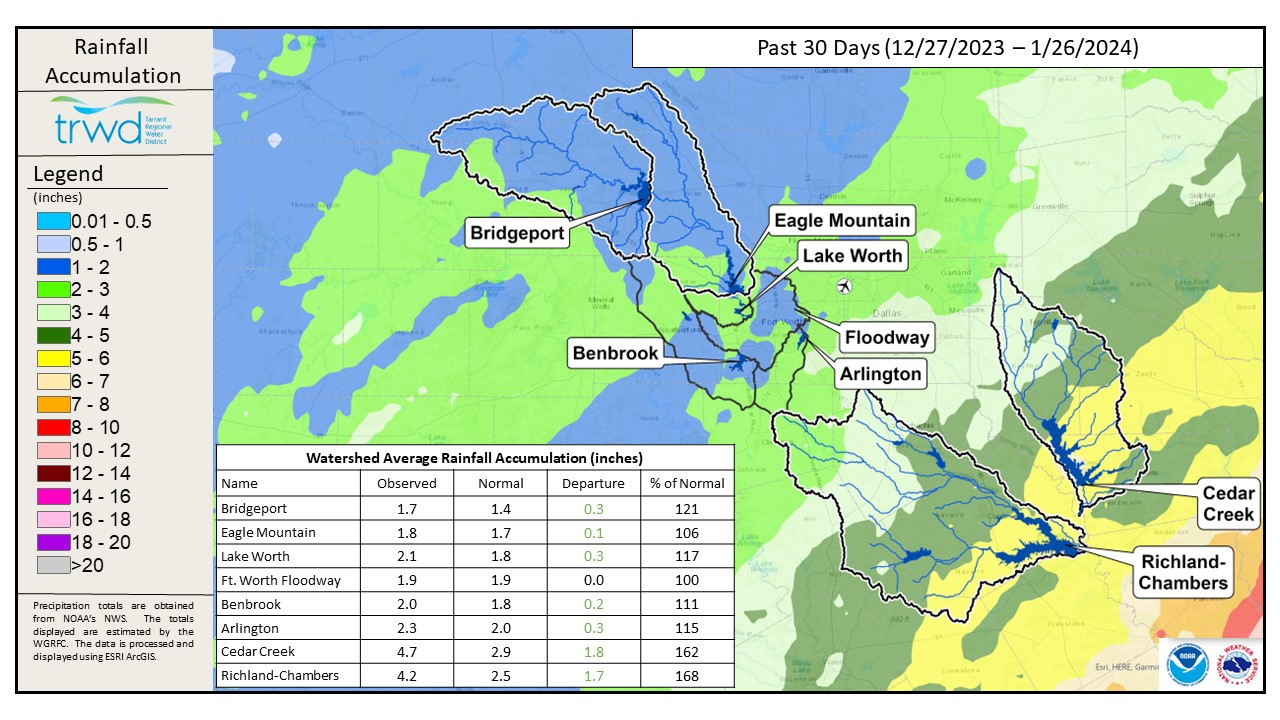
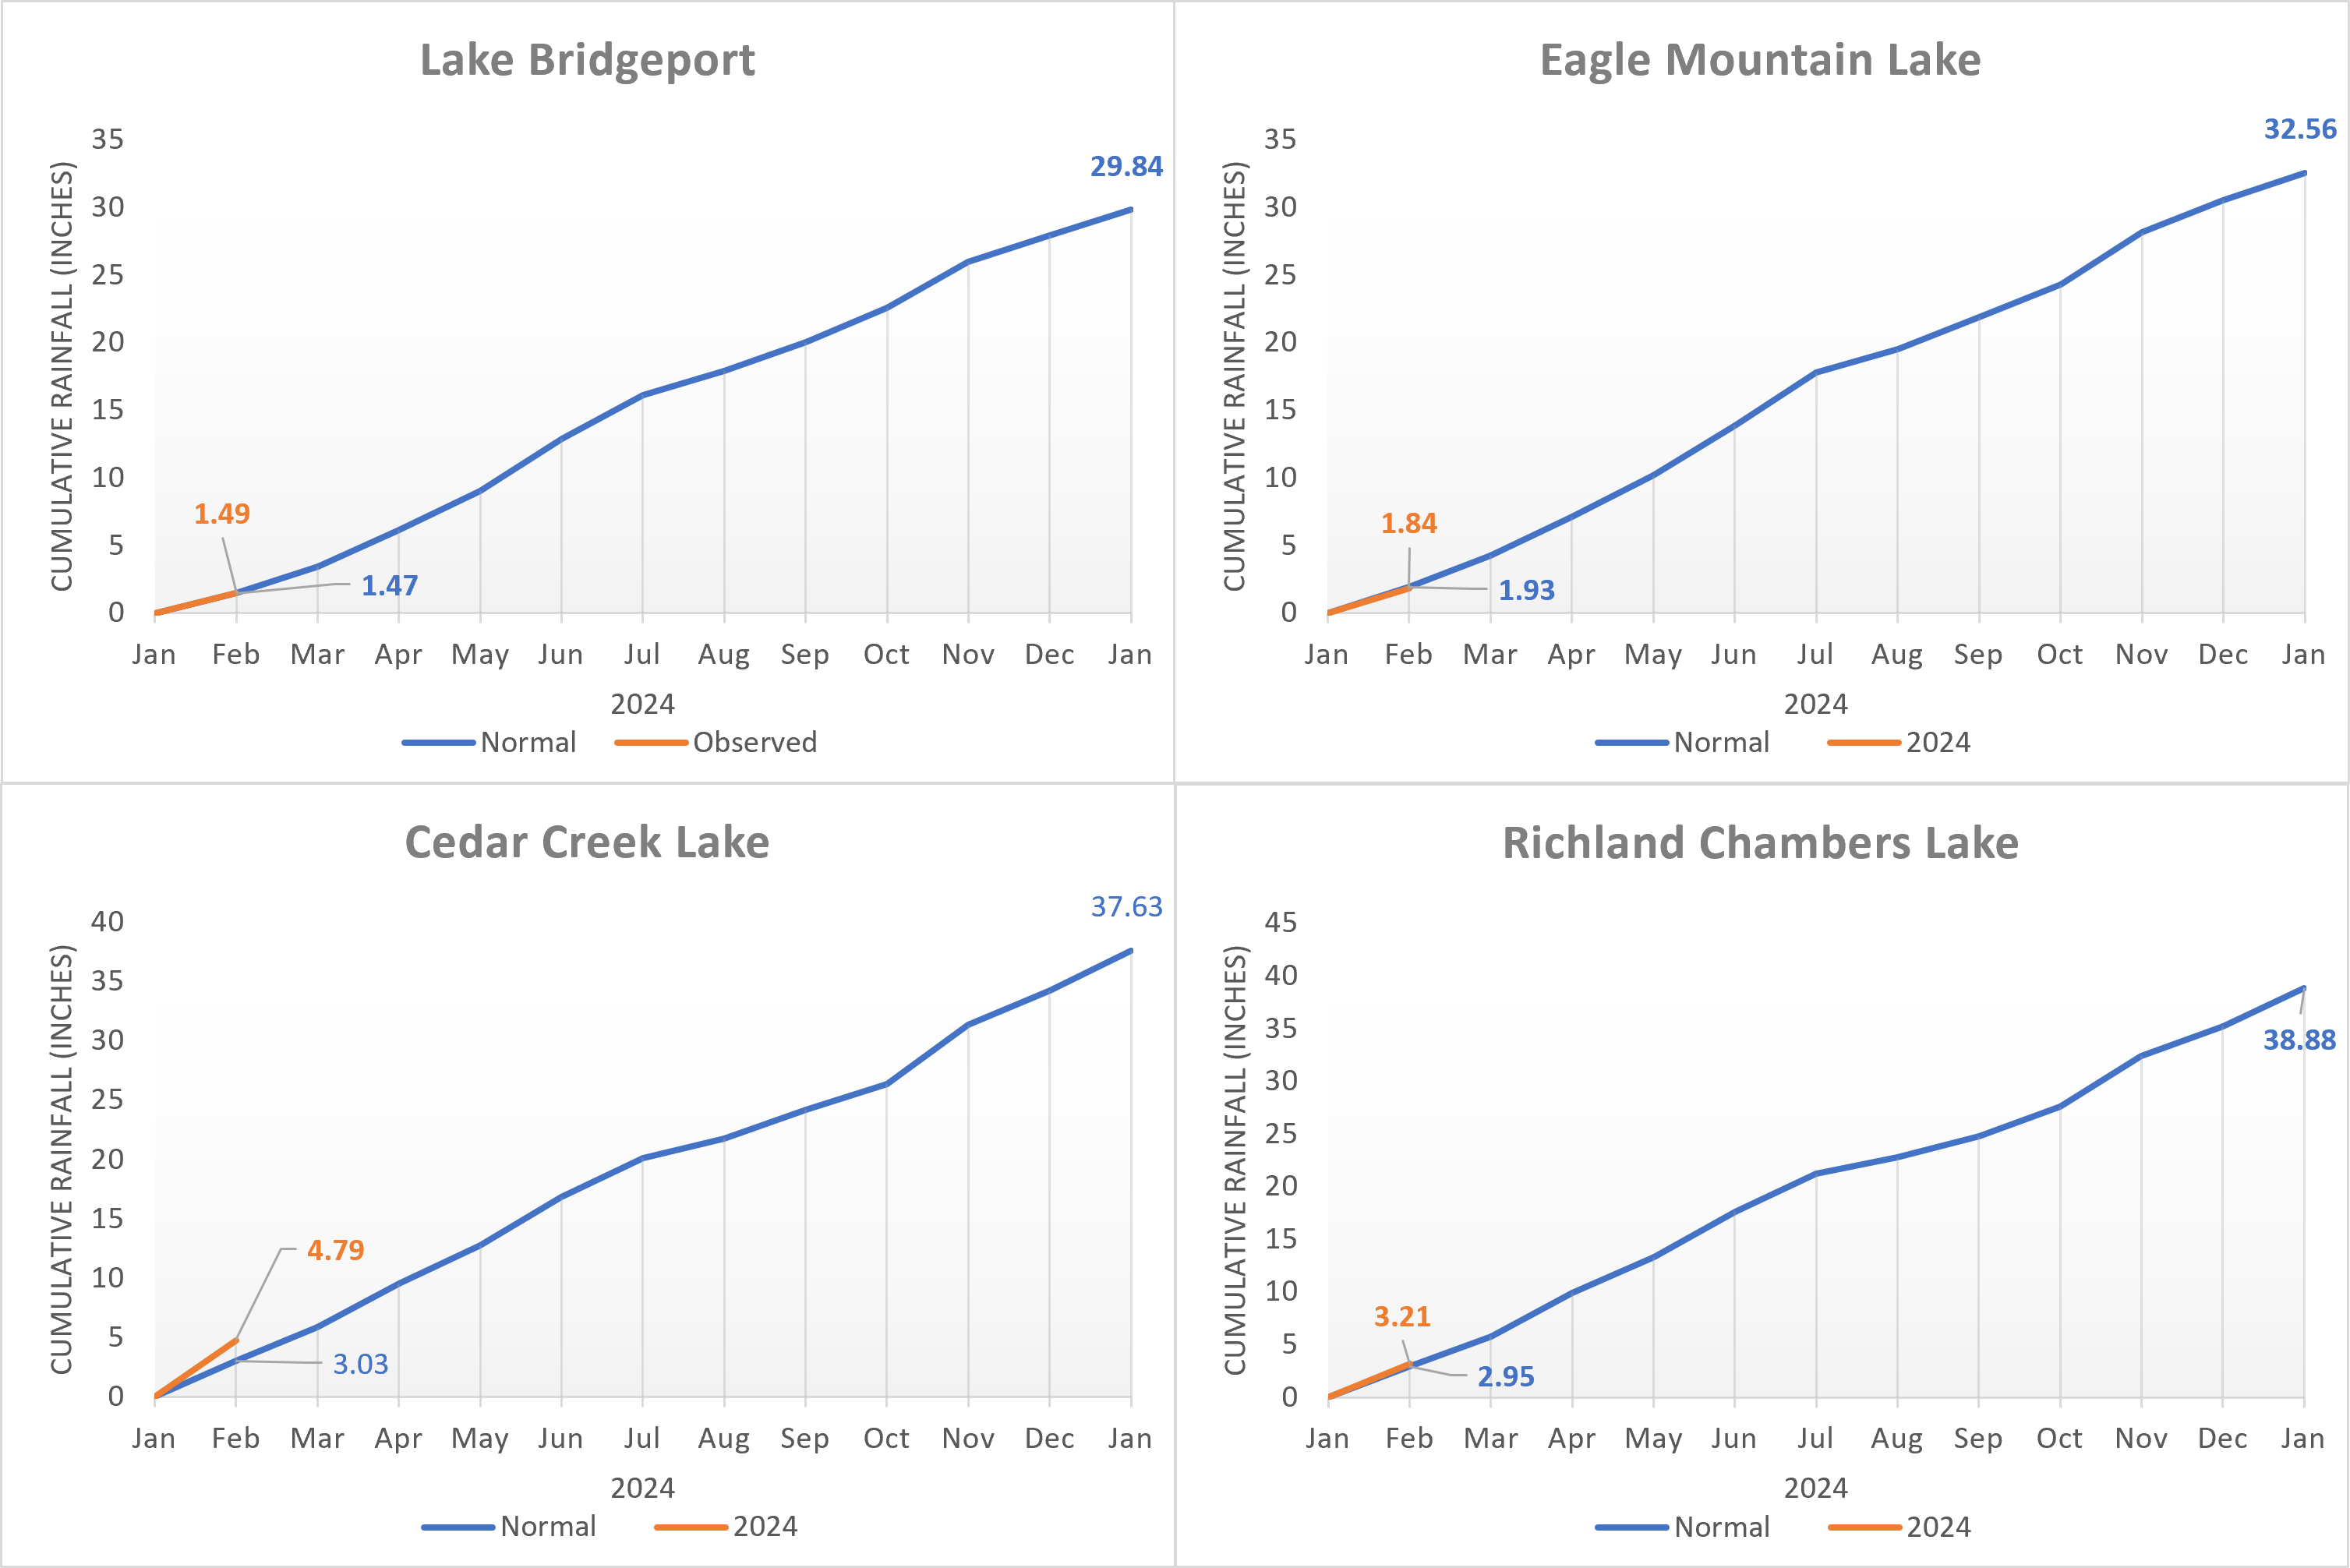
TRWD Lake Rainfall Totals though January 25, 2024
The January rainfall will help further improve North Texas drought conditions, which have already seen major improvement thanks to rain late in 2023.
Looking ahead…
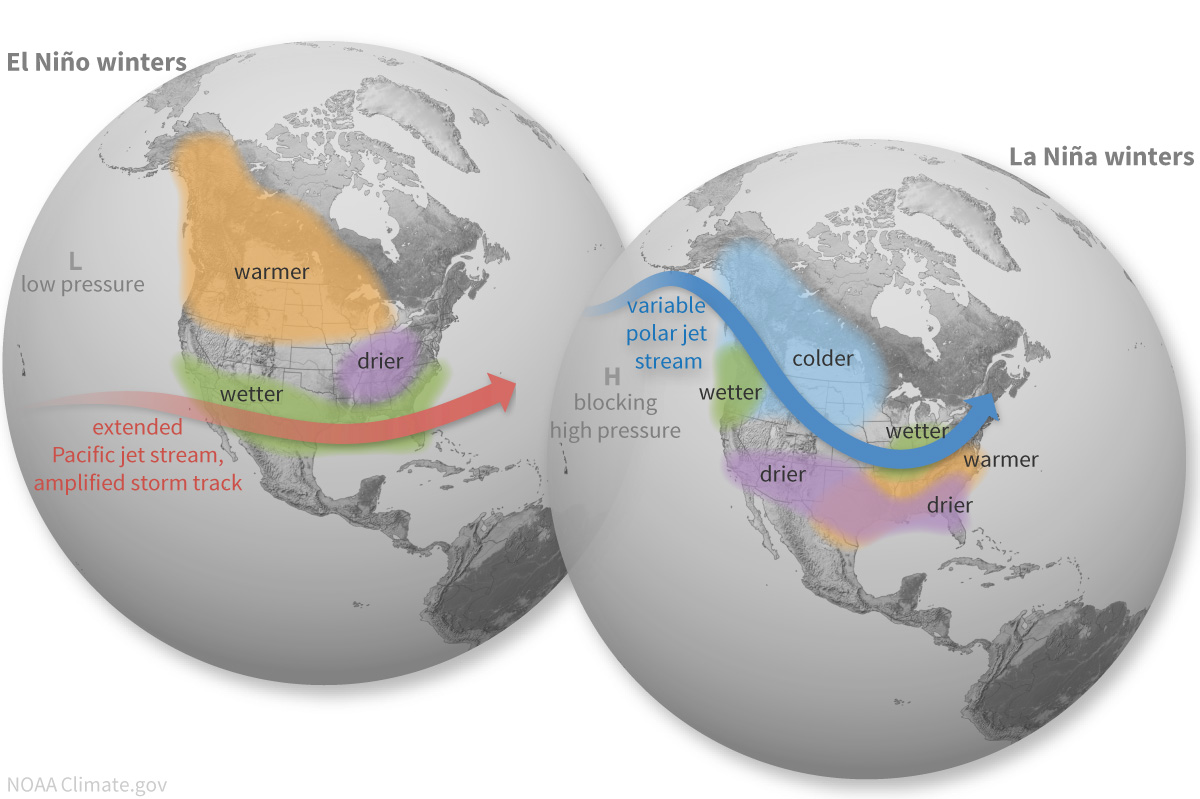
A higher chance of above normal temperatures and above normal precipitation for the first part of February is indicated in the 6-10 Day and 8-14 Day outlooks, according to The Climate Predication Center. The higher than normal precipitation outlook continues through early 2024 indicating the continued influence of El Nino where the jet stream typically shifts more favorably over the southern U.S. Typically, an El Nino in the Pacific means a wetter pattern across the southern part of the United States due to that shift. El Nino is expected to continue until April-June 2024 where there is a 73% chance of transitioning to neutral.
Projections
Lake Bridgeport

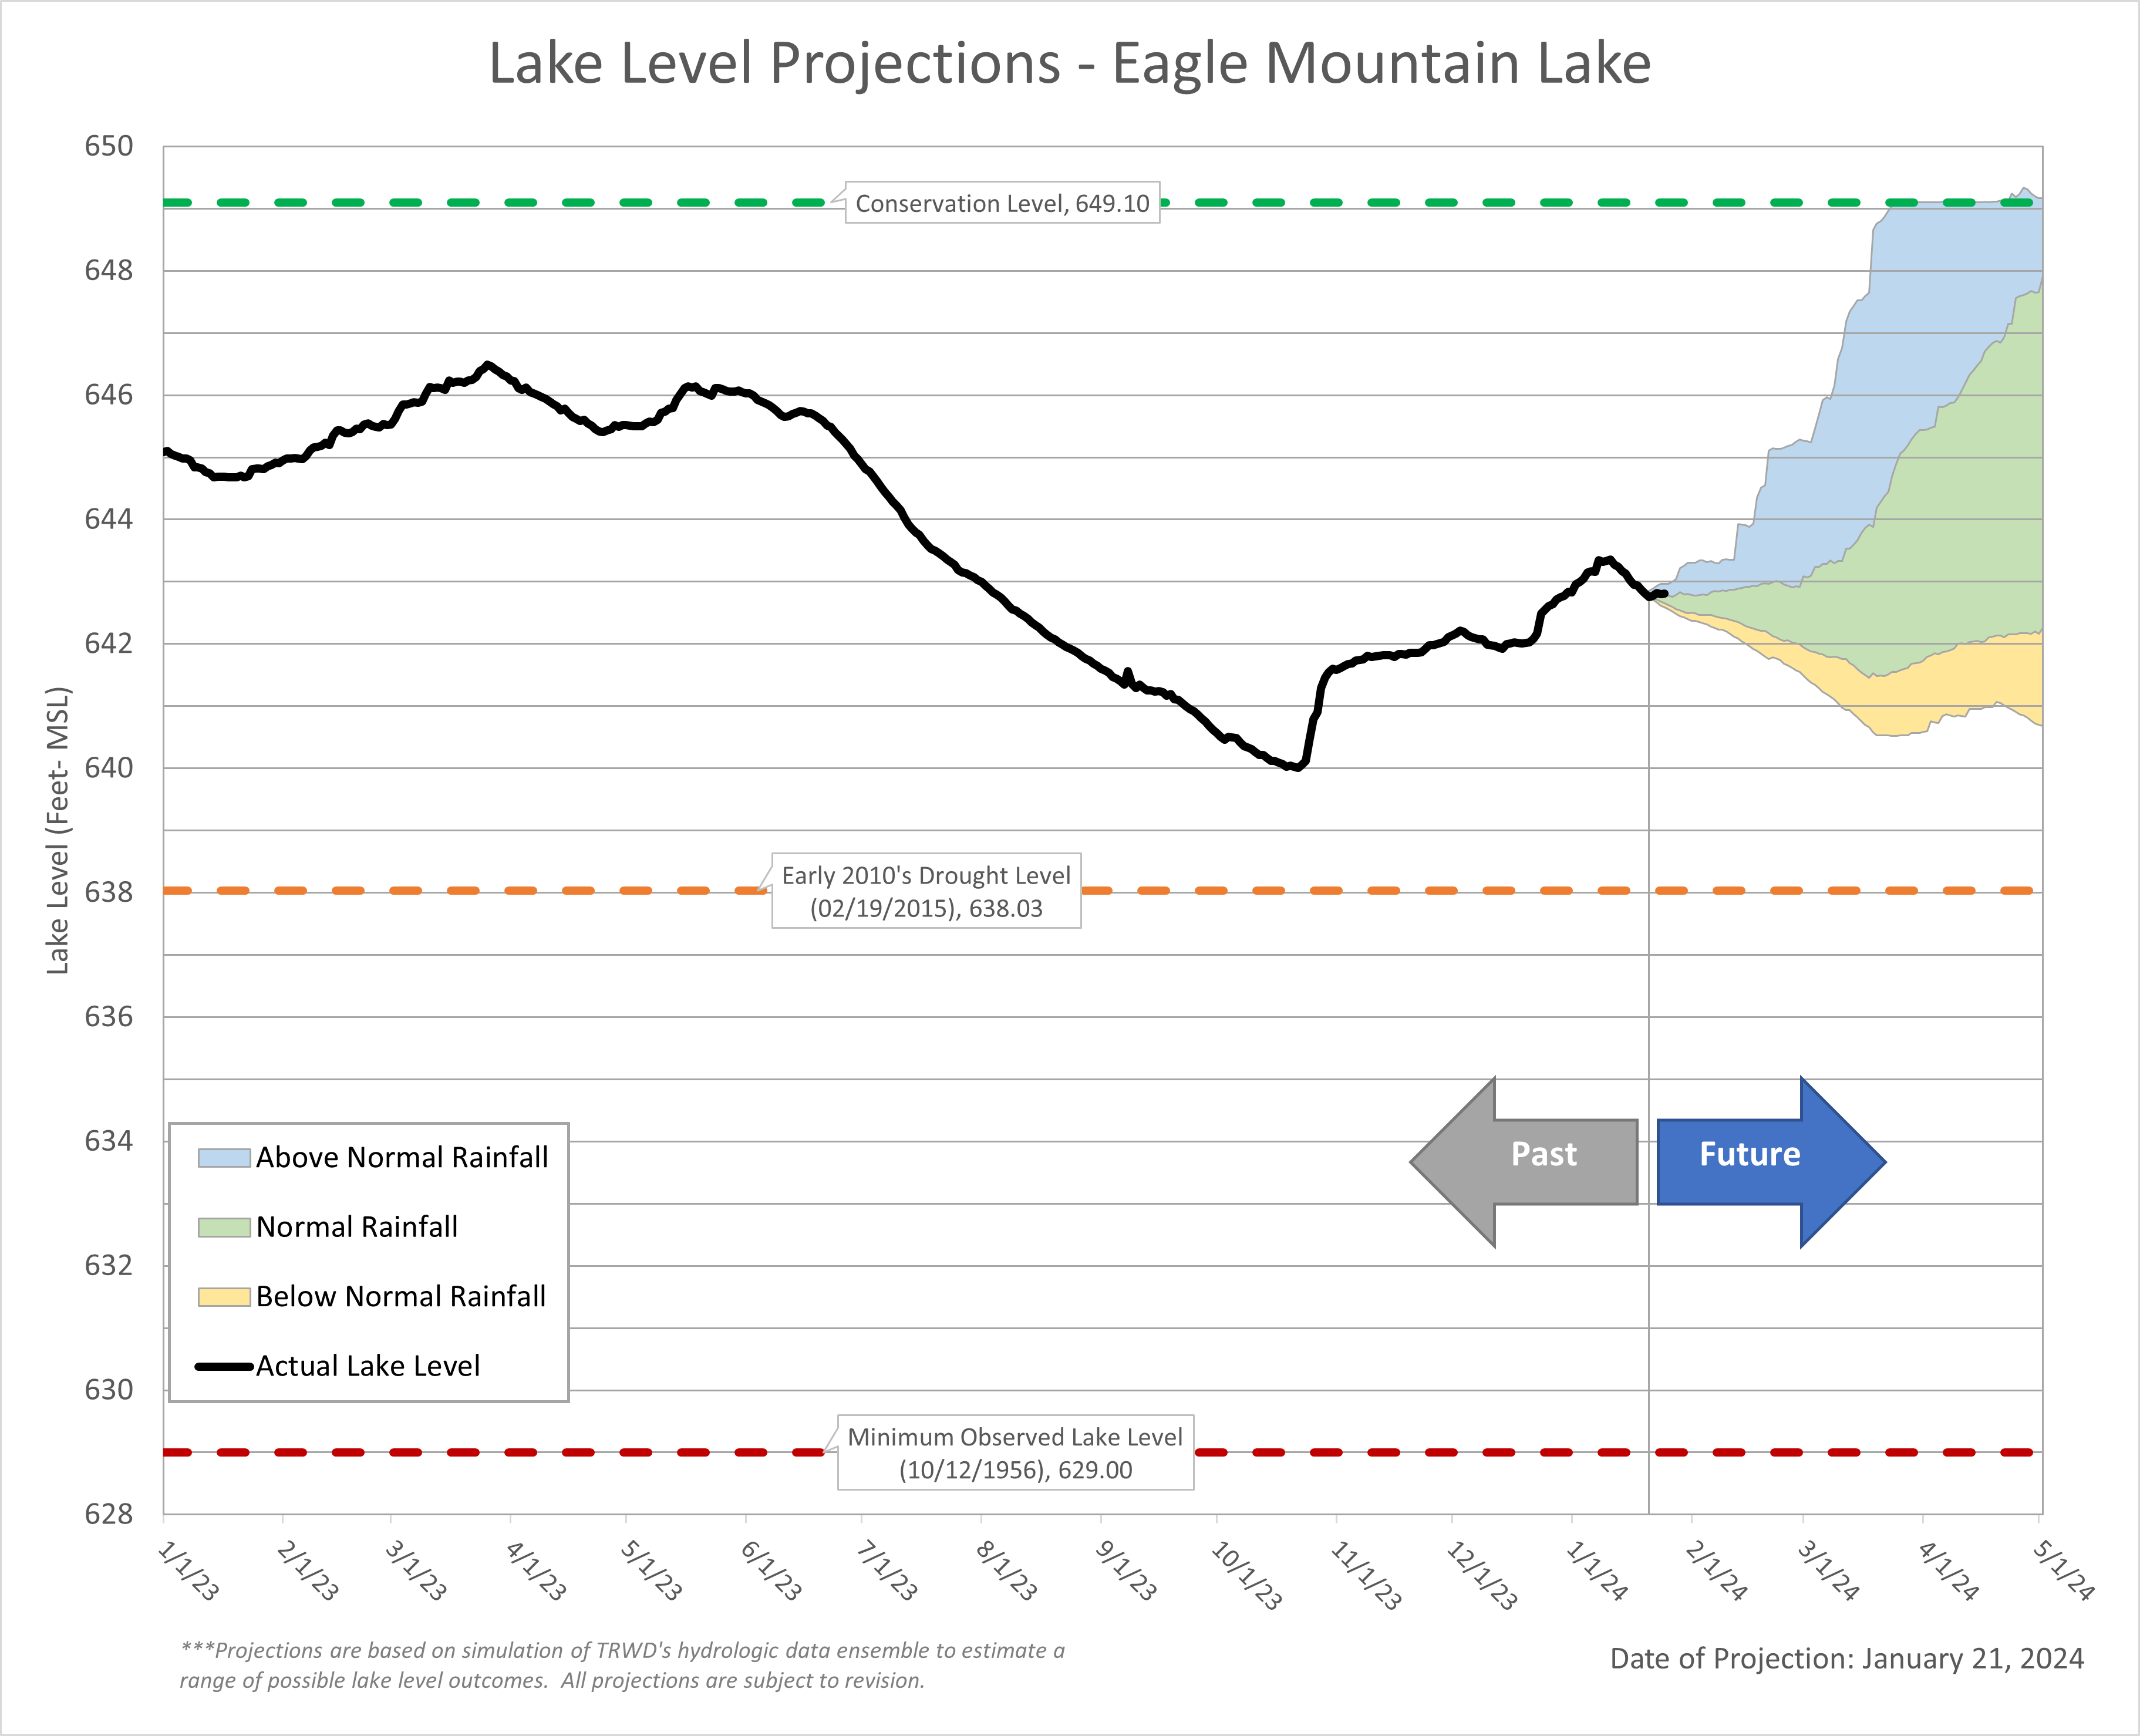
Eagle Mountain Lake
Cedar Creek Lake
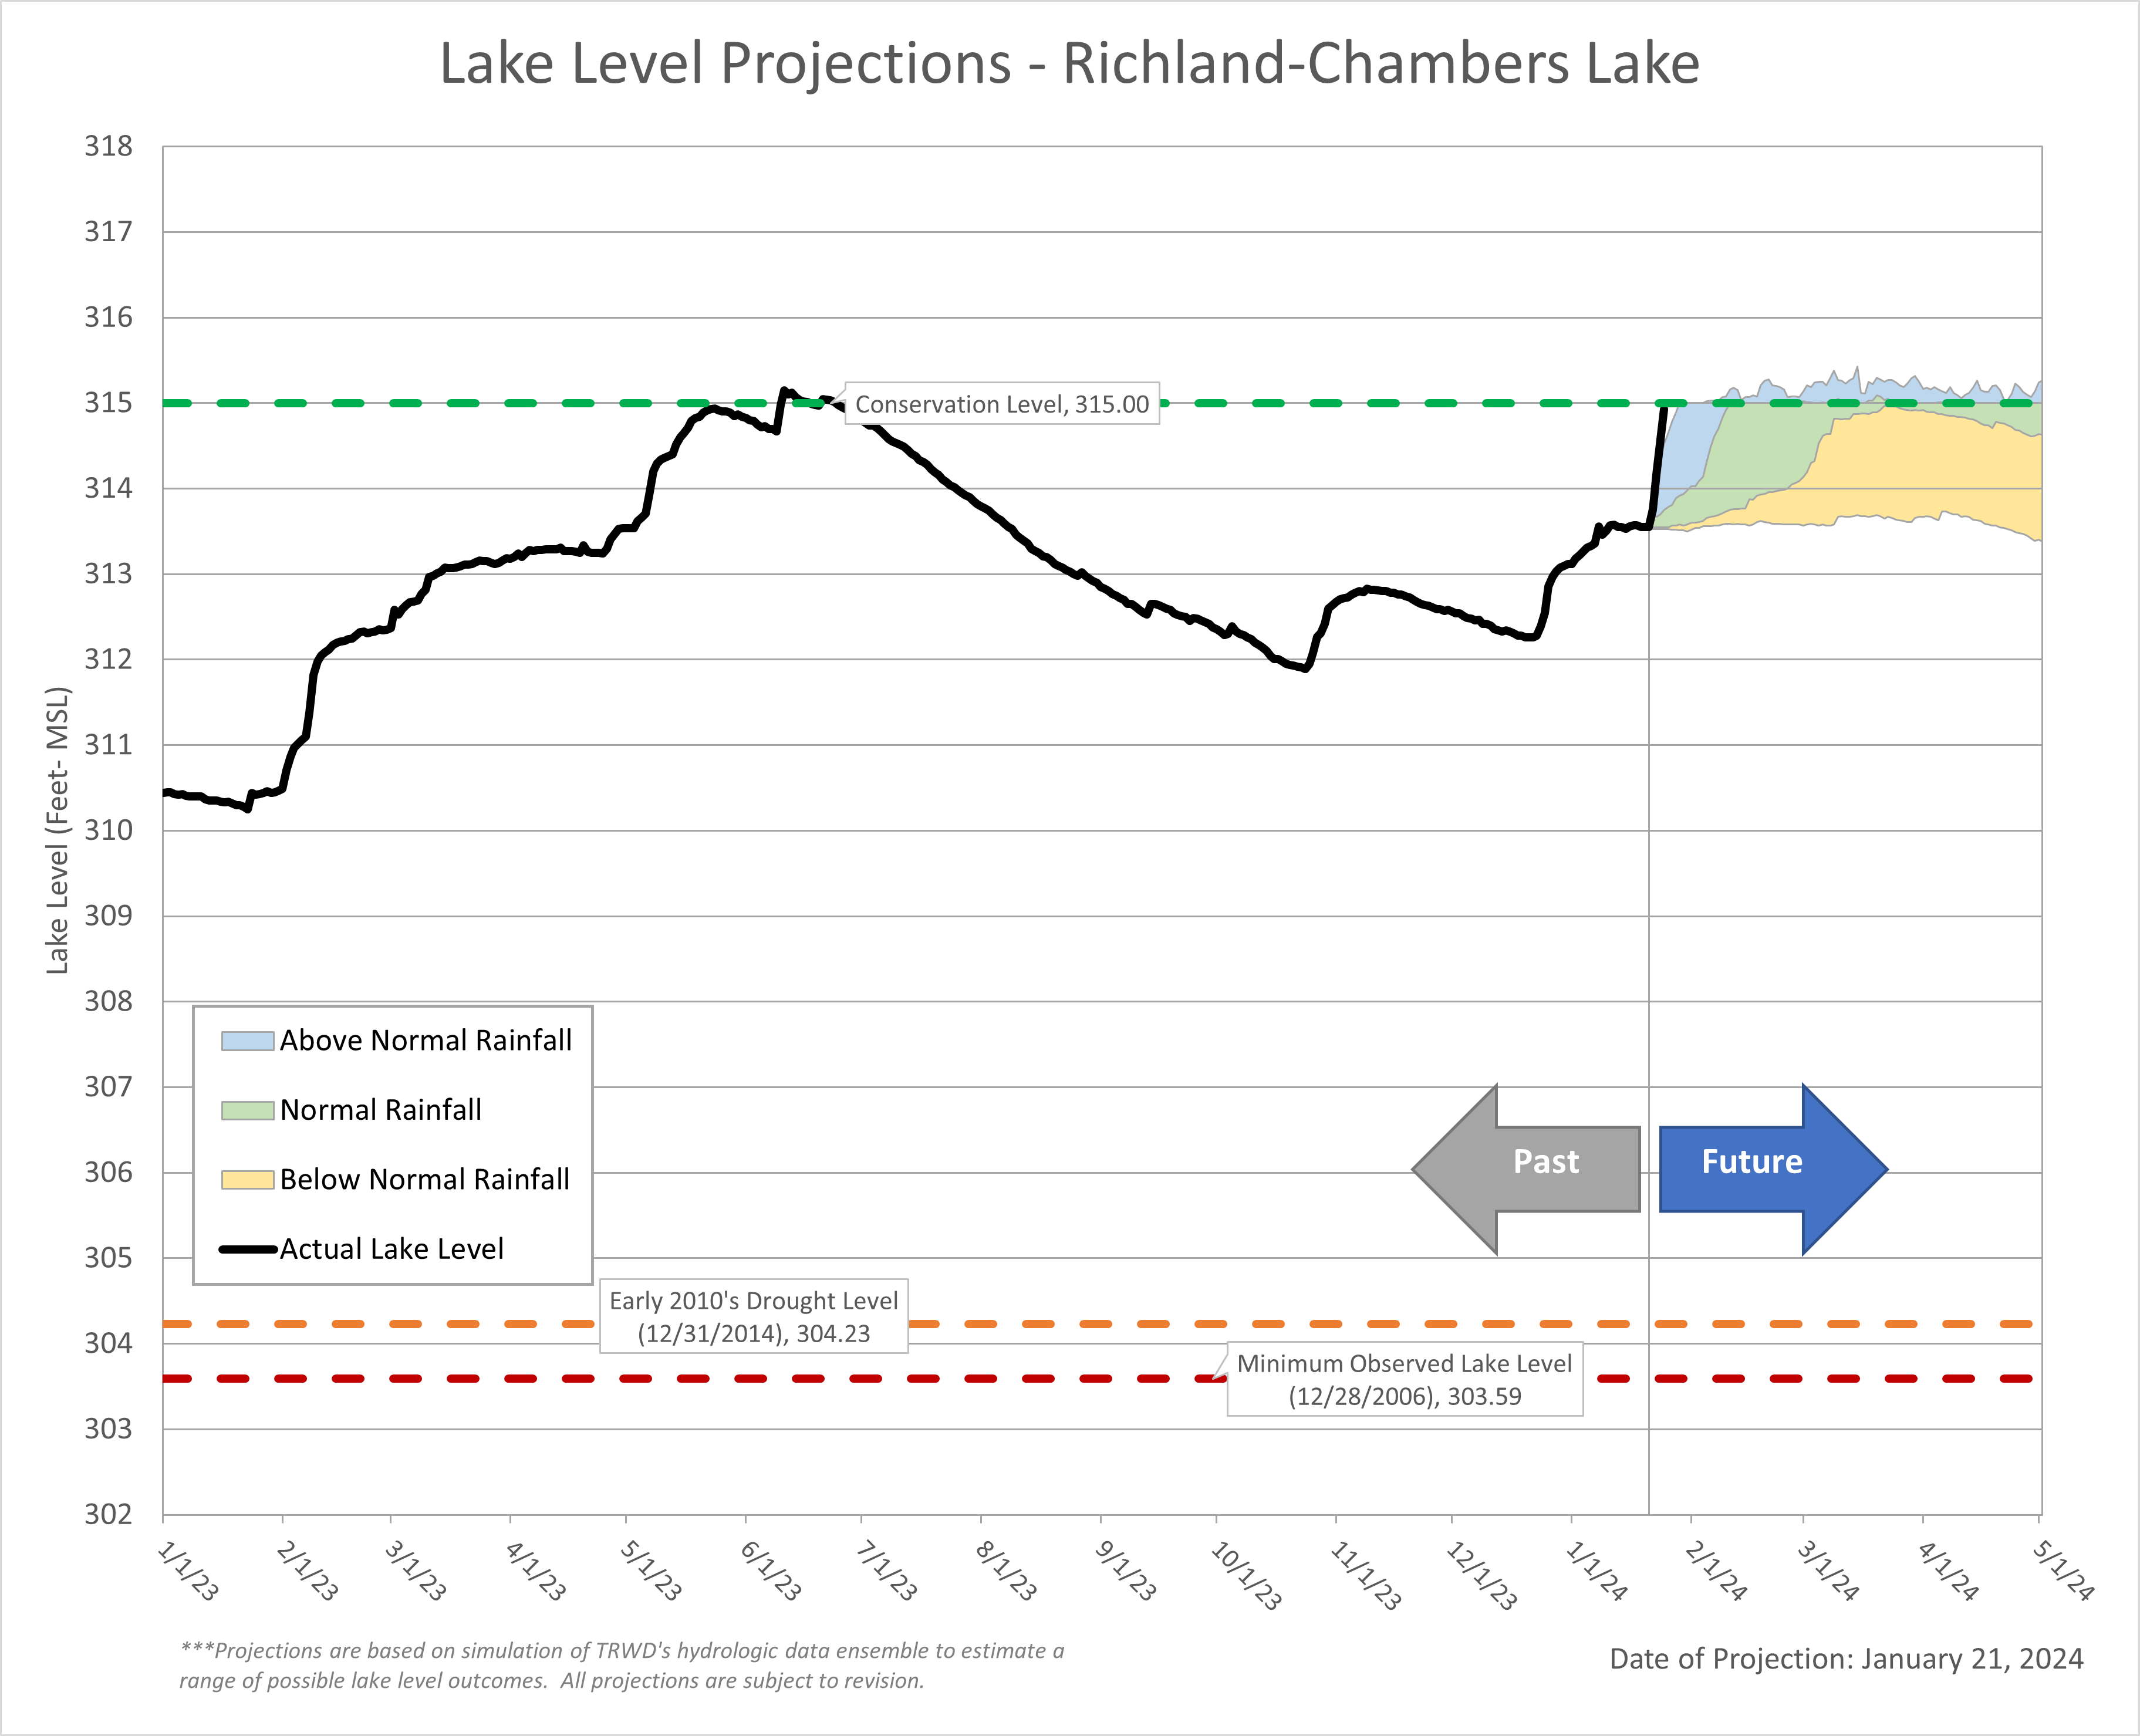
Richland-Chambers Lake