The latest lake level projections are shown below. You will also find:
- Links to historical lake level plots
- Last month’s projections compared to what actually happened.
As temperatures drop during the winter months, so do water usage and evaporation rates. This will help keep water from leaving the lakes. TRWD’s Meteorologist, Courtney Jalbert, provides discussion on what we can expect in terms of rainfall adding water to the lakes in the “From our Meteorologist” section. Thank you for following the Lake Level Blog and check back next month about this time for more projections.
From our Meteorologist
November Summary…
To date, November has been warmer and drier than normal. Precipitation totals in the TRWD watersheds are about 1.5 inches below normal for the past 30-days, see map below. A cold front is expected to arrive the last day of November and should help bring precipitation totals a little closer to normal.
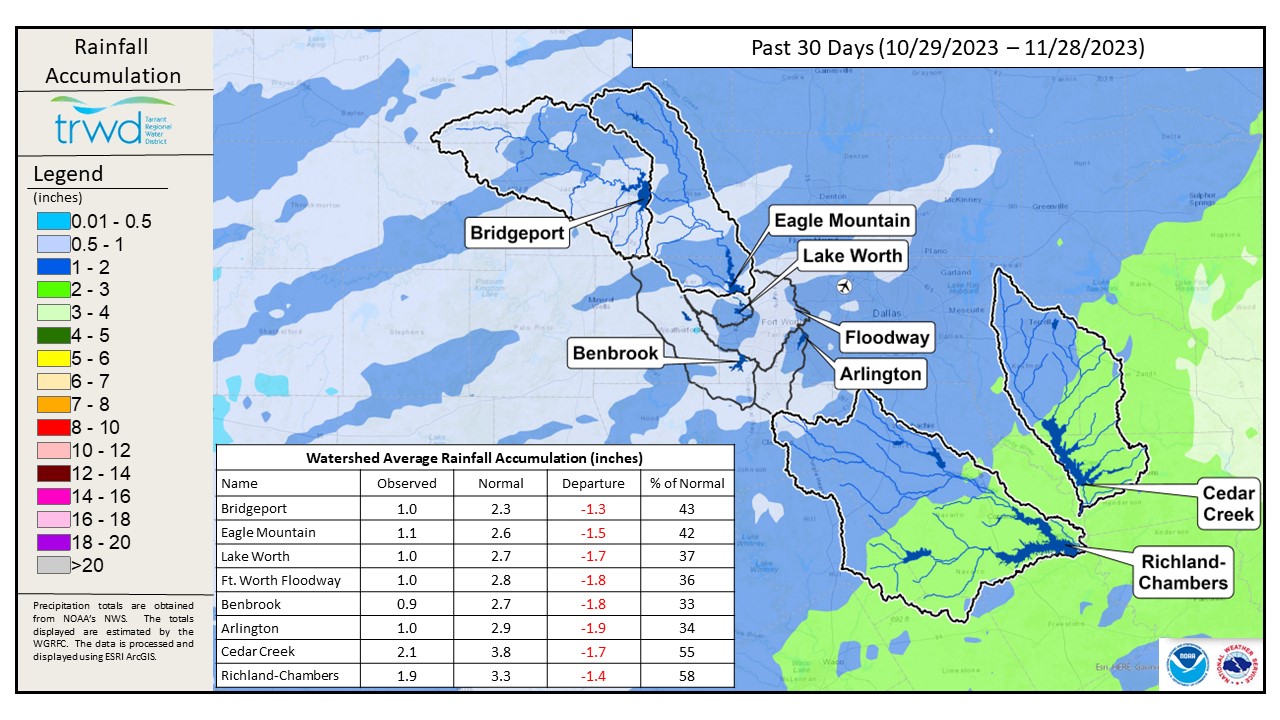
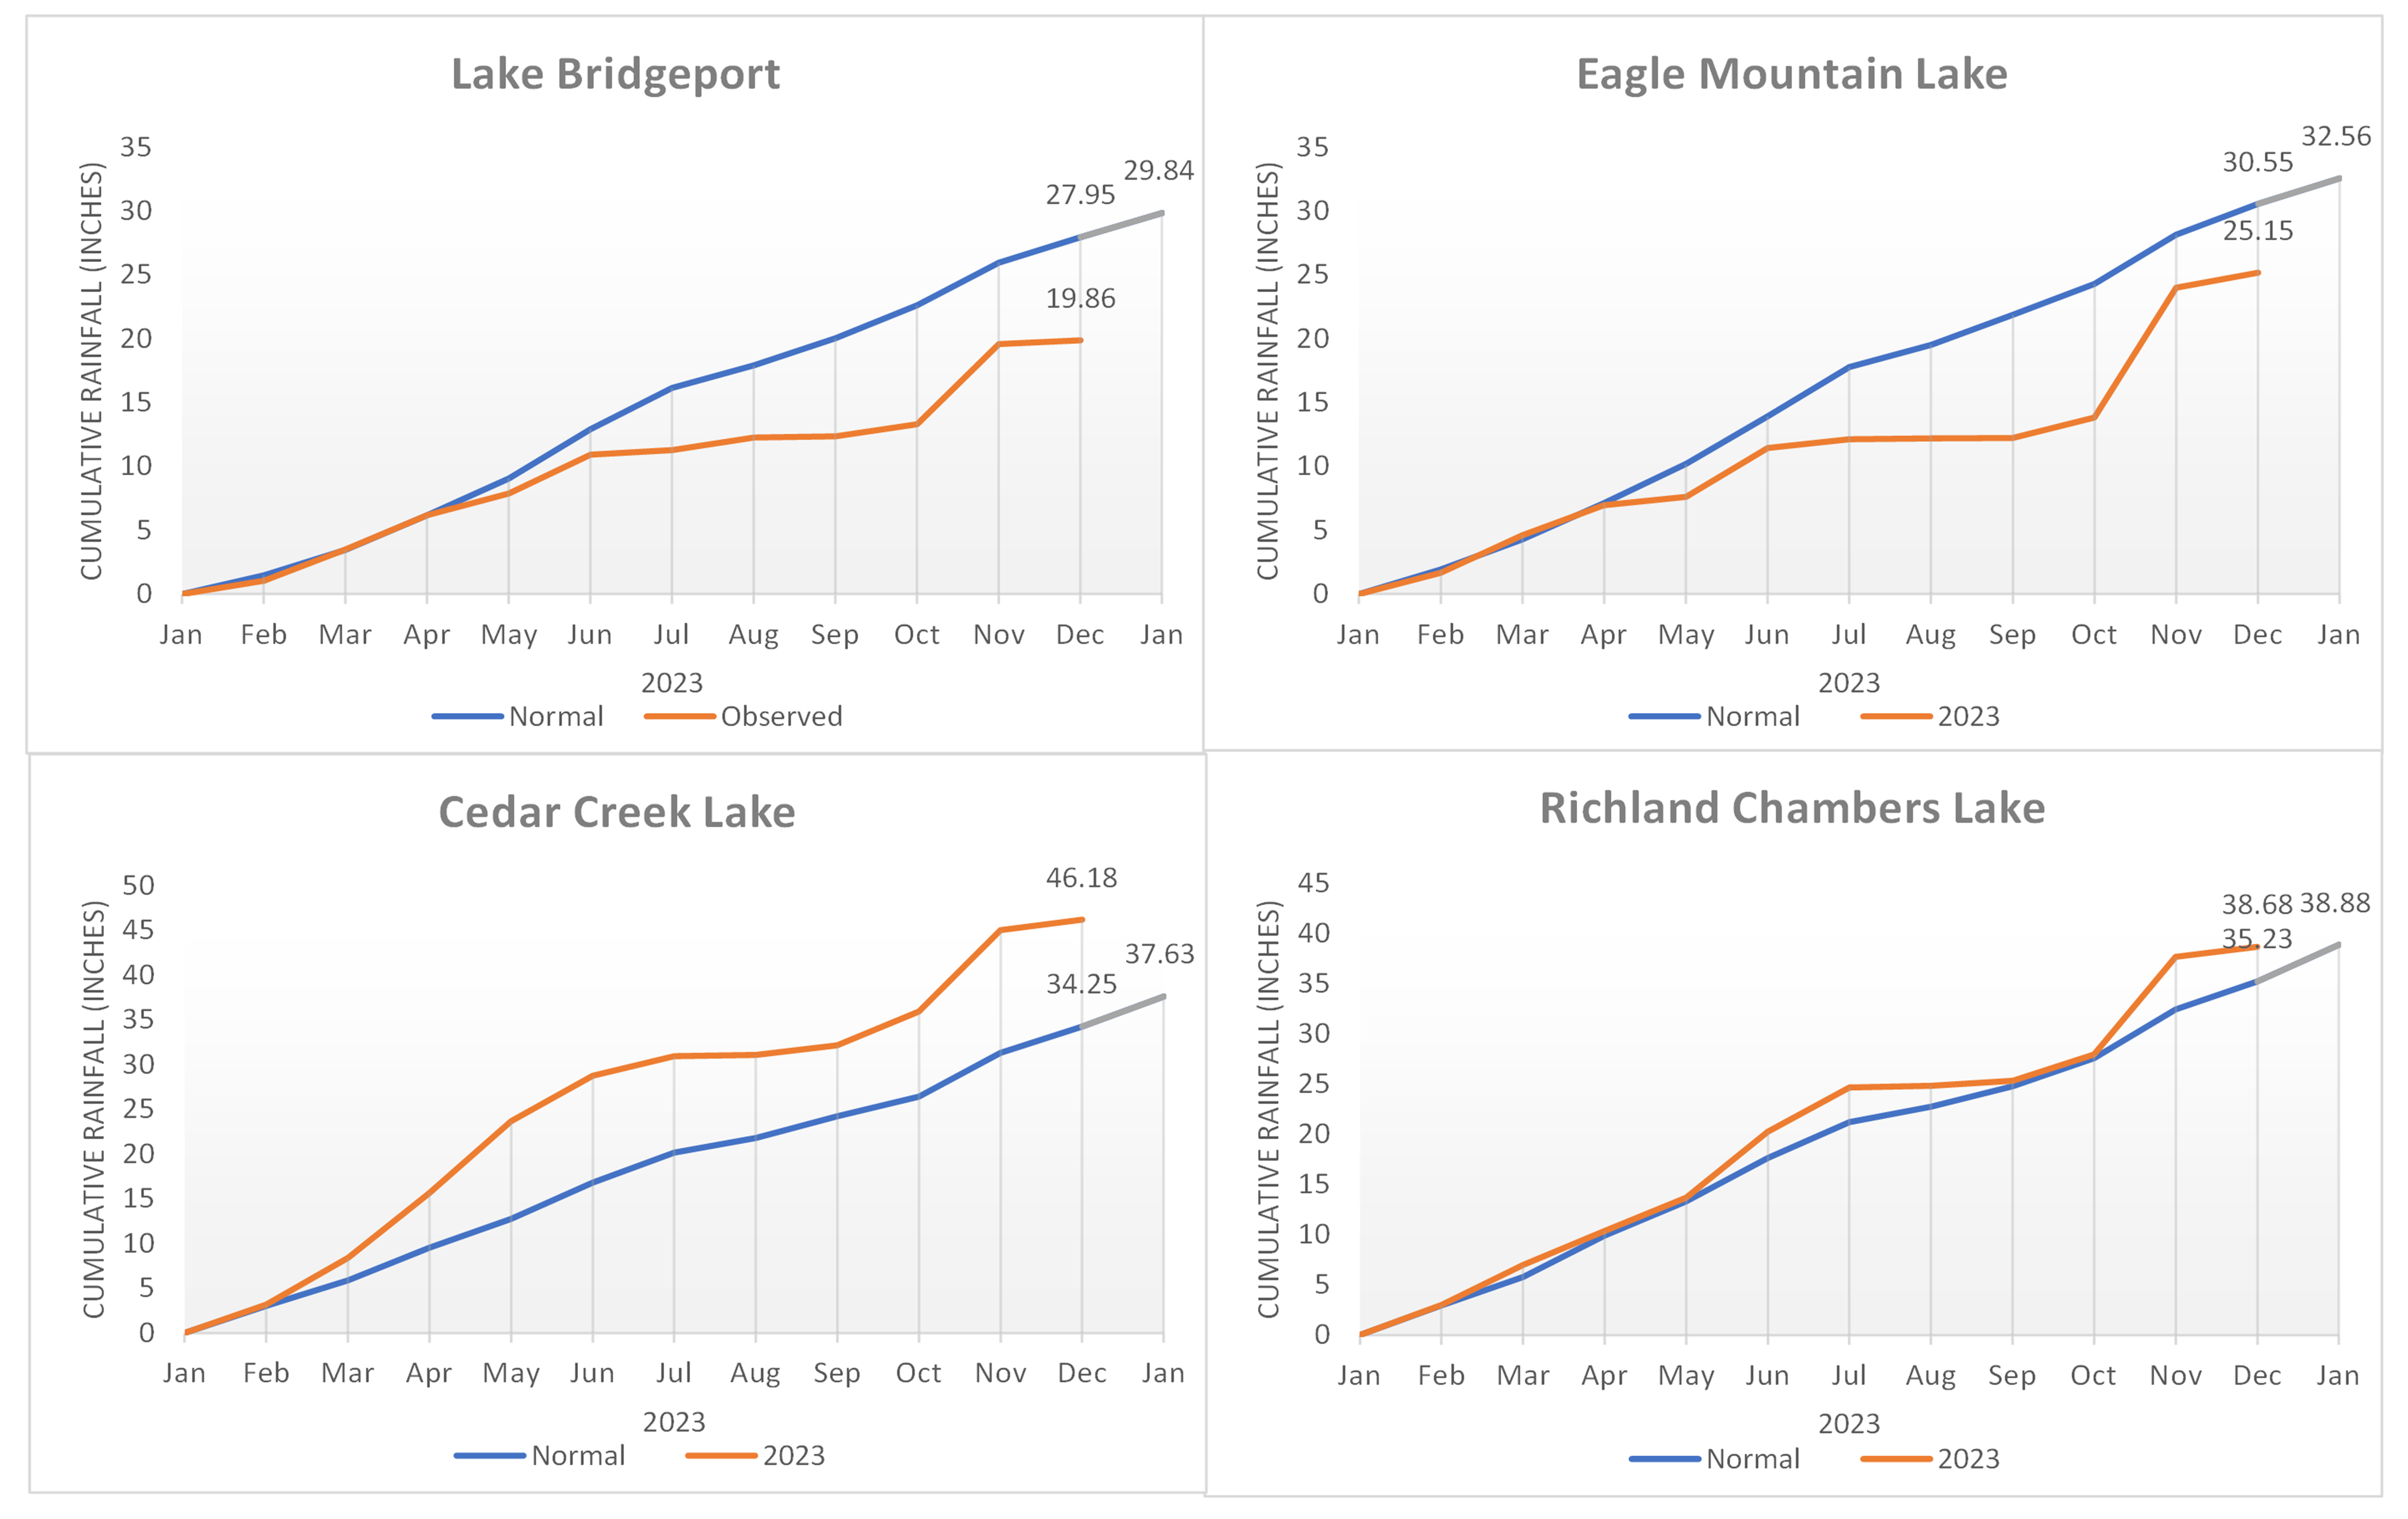
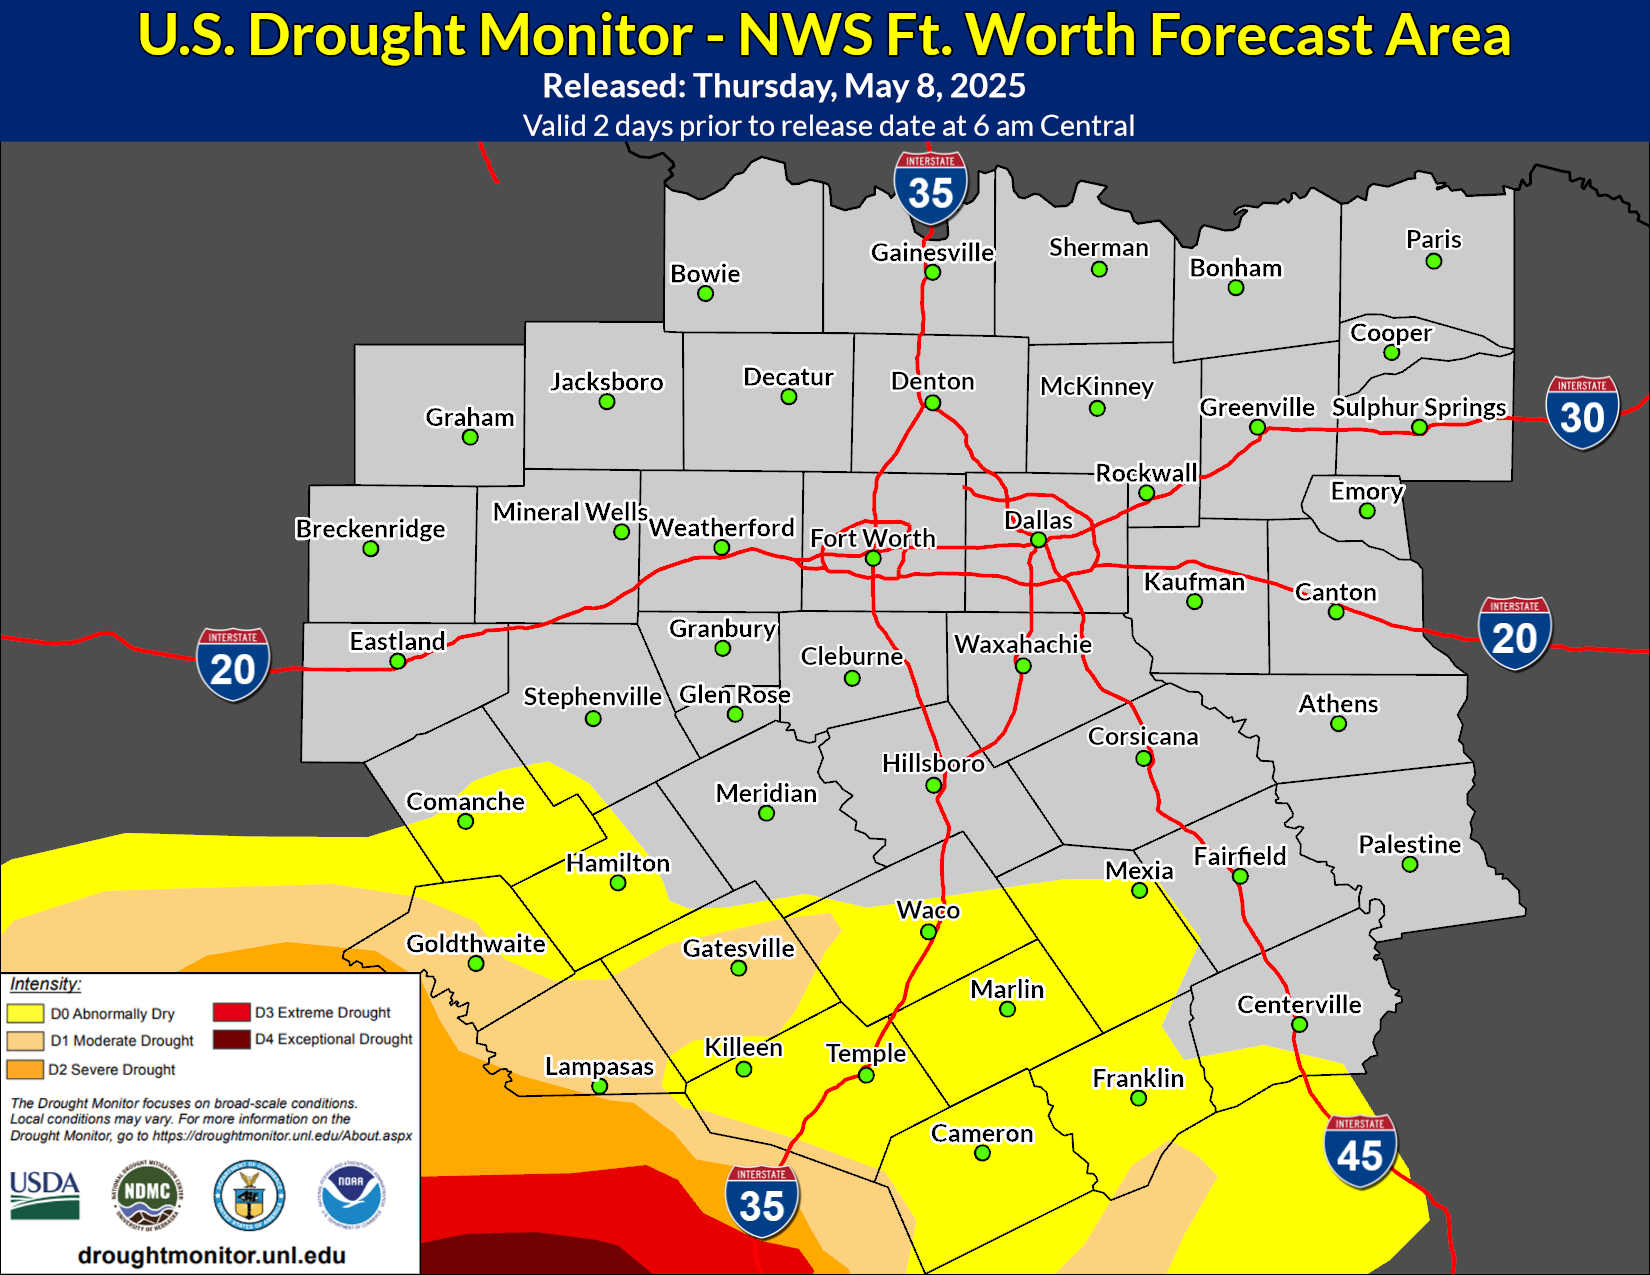
For the year, DFW Airport has an accumulated of 25.70” of rainfall; this is still 8.32” below normal. The TRWD lakes are divided east and west with the eastern lakes (Cedar Creek and Richland-Chambers) above average rainfall for the year and the western lakes (Bridgeport and Eagle Mountain) below average for the year, see TRWD Lake Rain Totals below. While we have seen some improvements in drought intensities, North Texas remains in drought as of November 23rd as seen in the latest U.S. Drought Monitor. The highest category in the TRWD watershed is over parts of the West Fork with D1, Moderate Drought still in place.
TRWD Lake Rainfall Totals though November 28, 2023
 Looking ahead…
The Climate Predication Center indicates a higher chance of above normal temperatures and below normal precipitation at least for the first half of December. There is a little bit more optimism in the seasonal precipitation outlook that extends through early 2024 for above normal chances of precipitation which is reflecting the expected influence of El Nino where the jet stream typically shifts more favorably over the southern U.S. Typically, an El Nino in the Pacific means a wetter pattern across the southern part of the United States due to that shift. El Nino has a greater than 62% chance of extending into April through June of 2024. Even with chances of enhanced precipitation amounts during the upcoming winter, the extraordinary deficits from 2023 will take time to turn around.
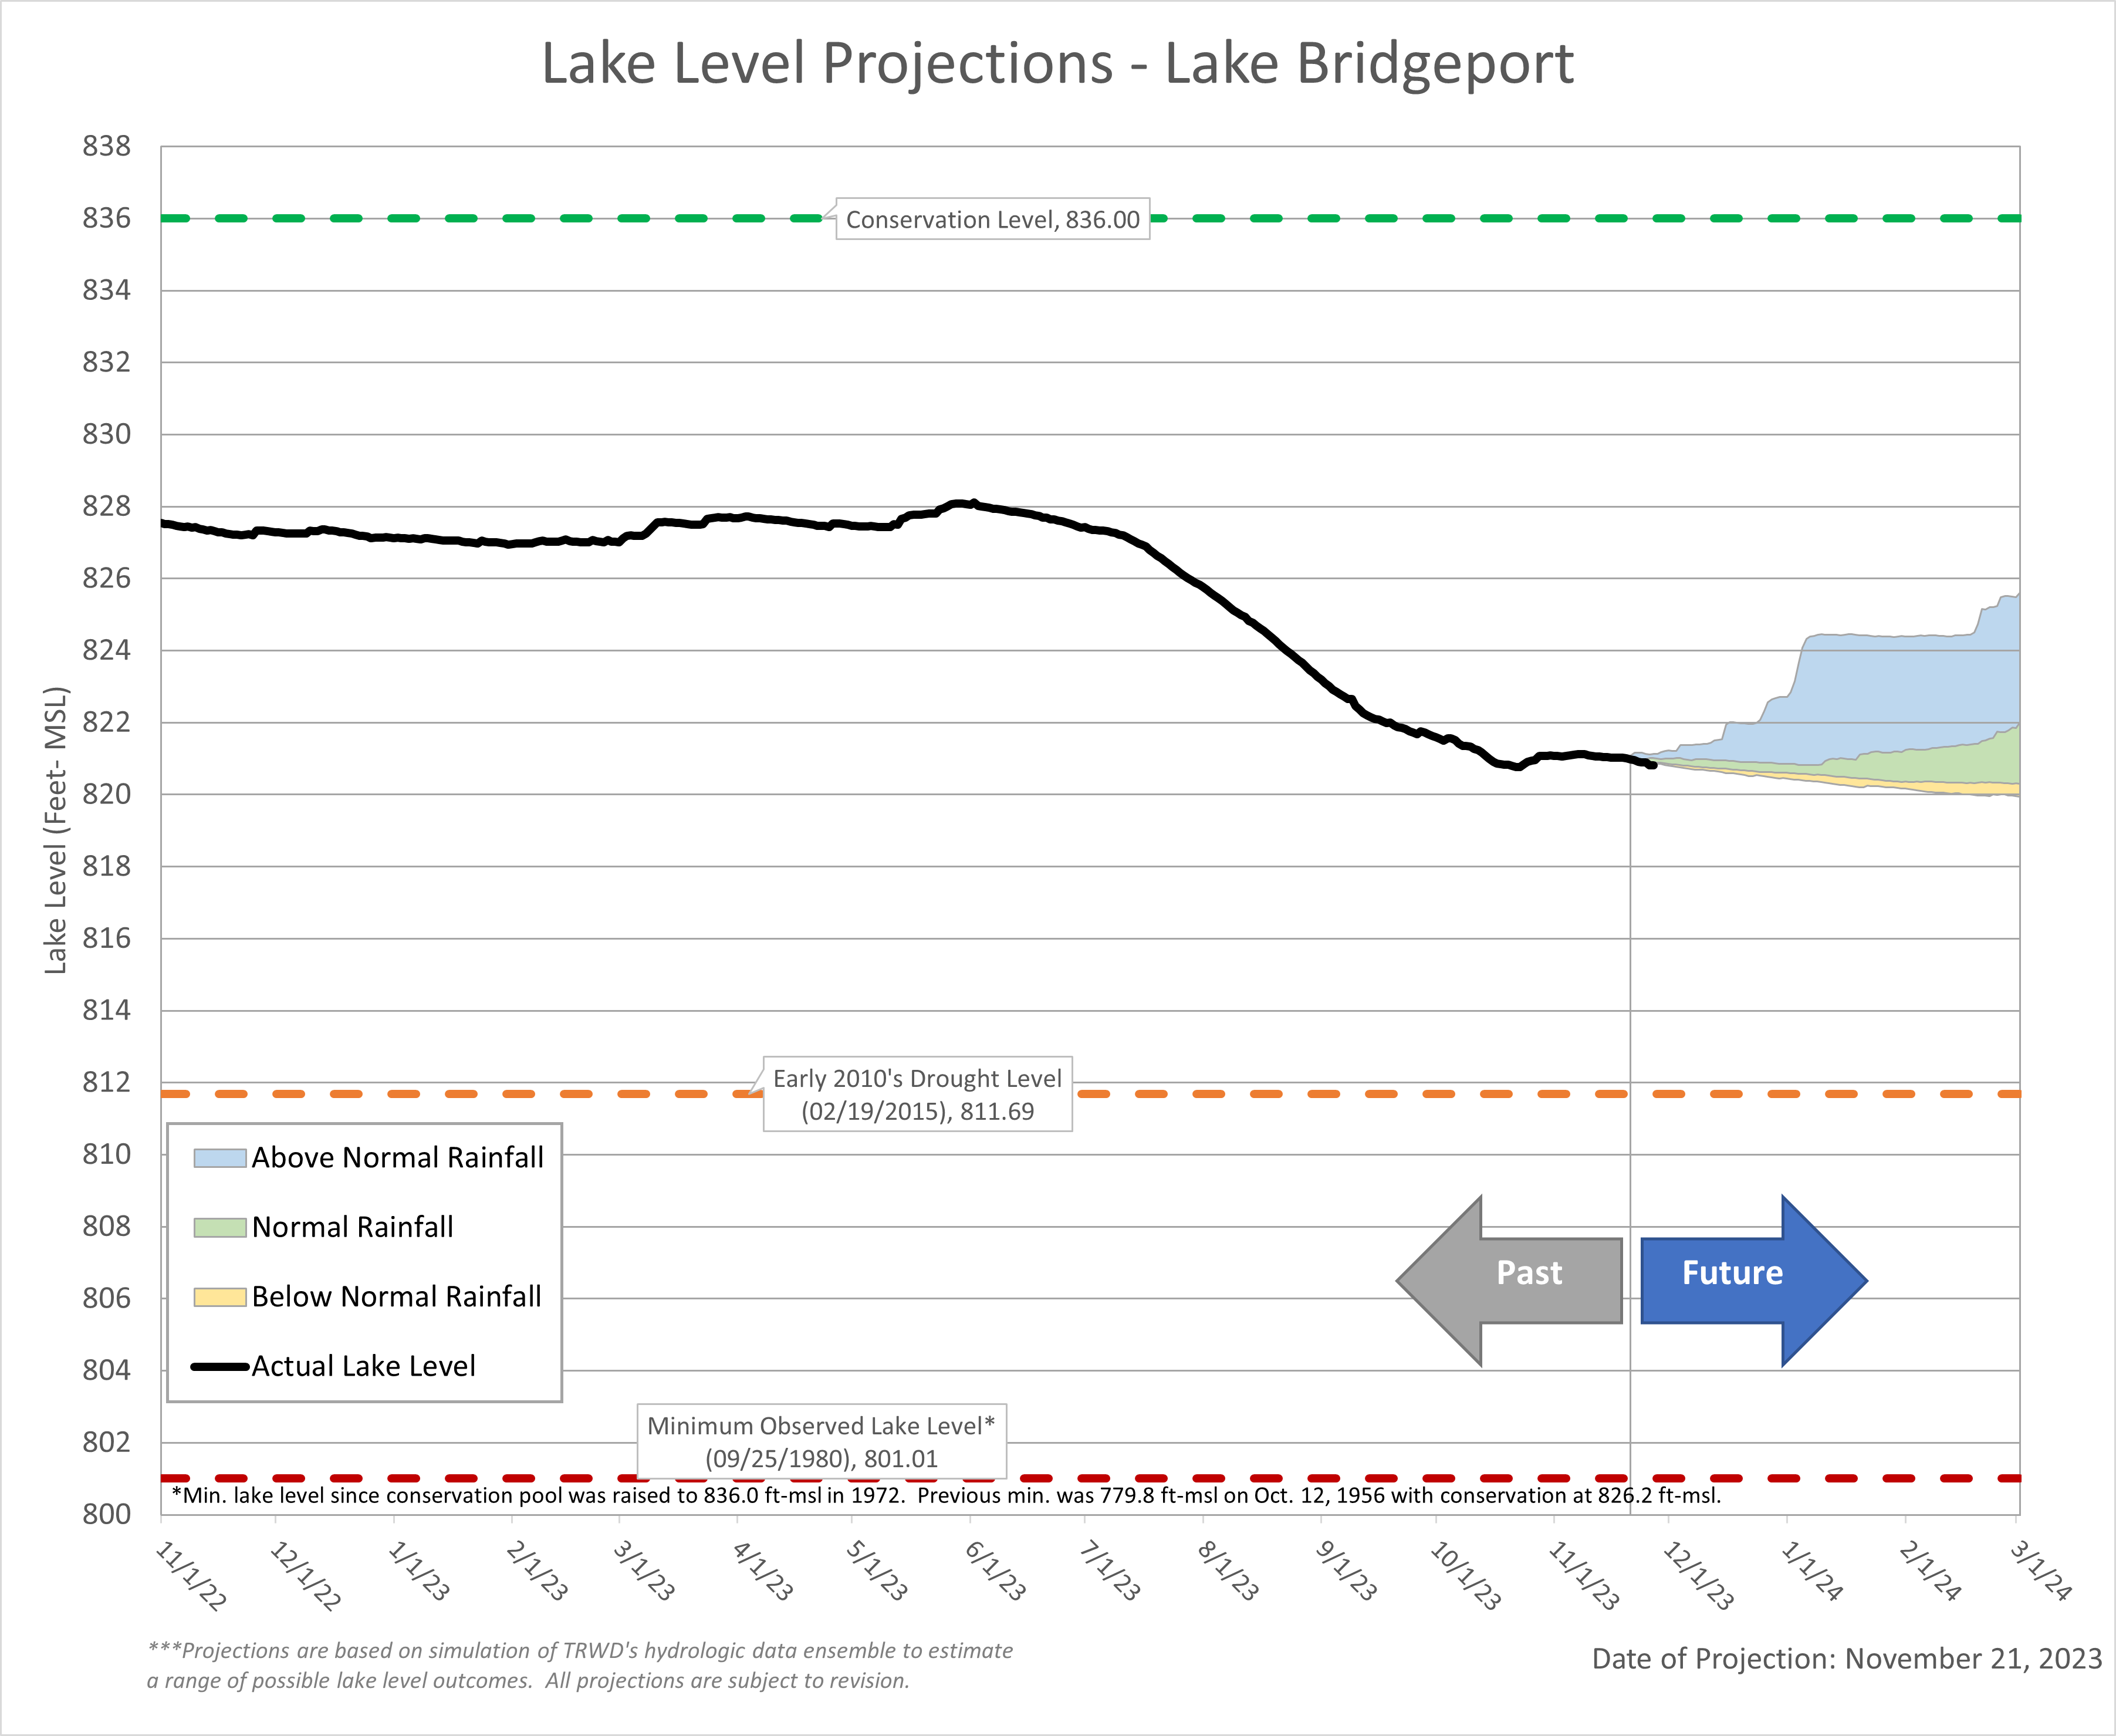
Projections
Lake Bridgeport
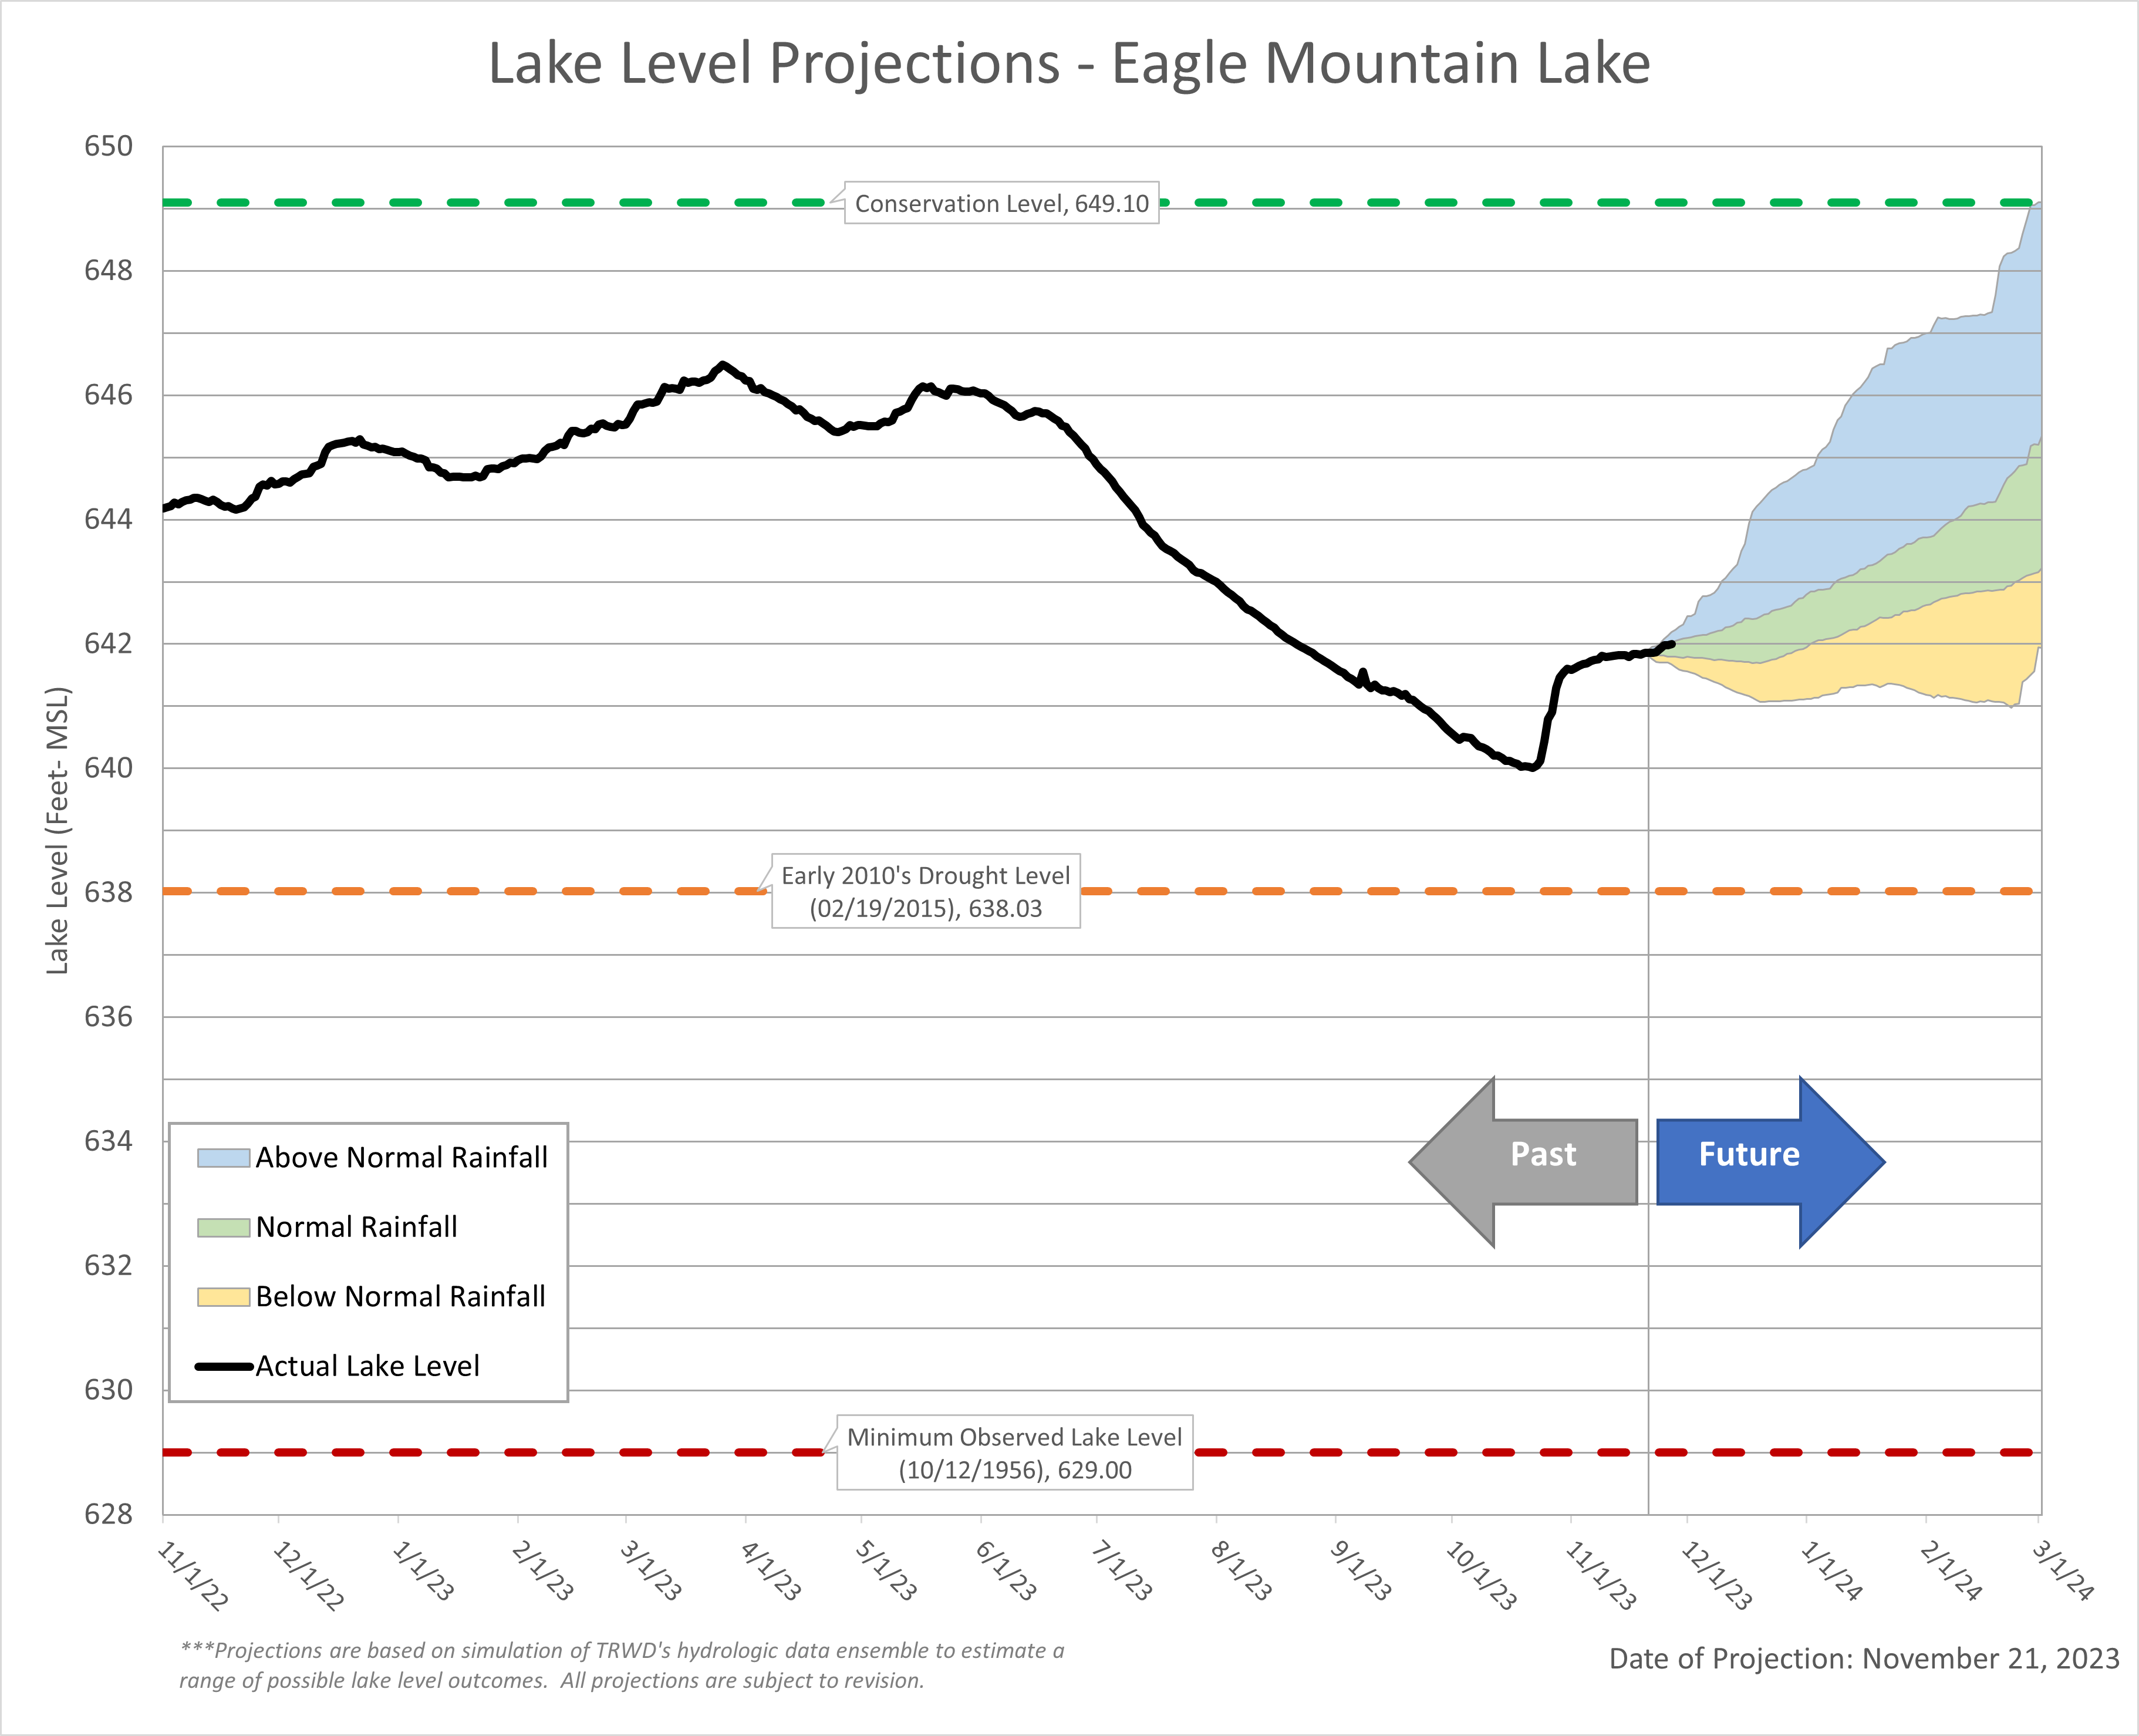
Eagle Mountain Lake
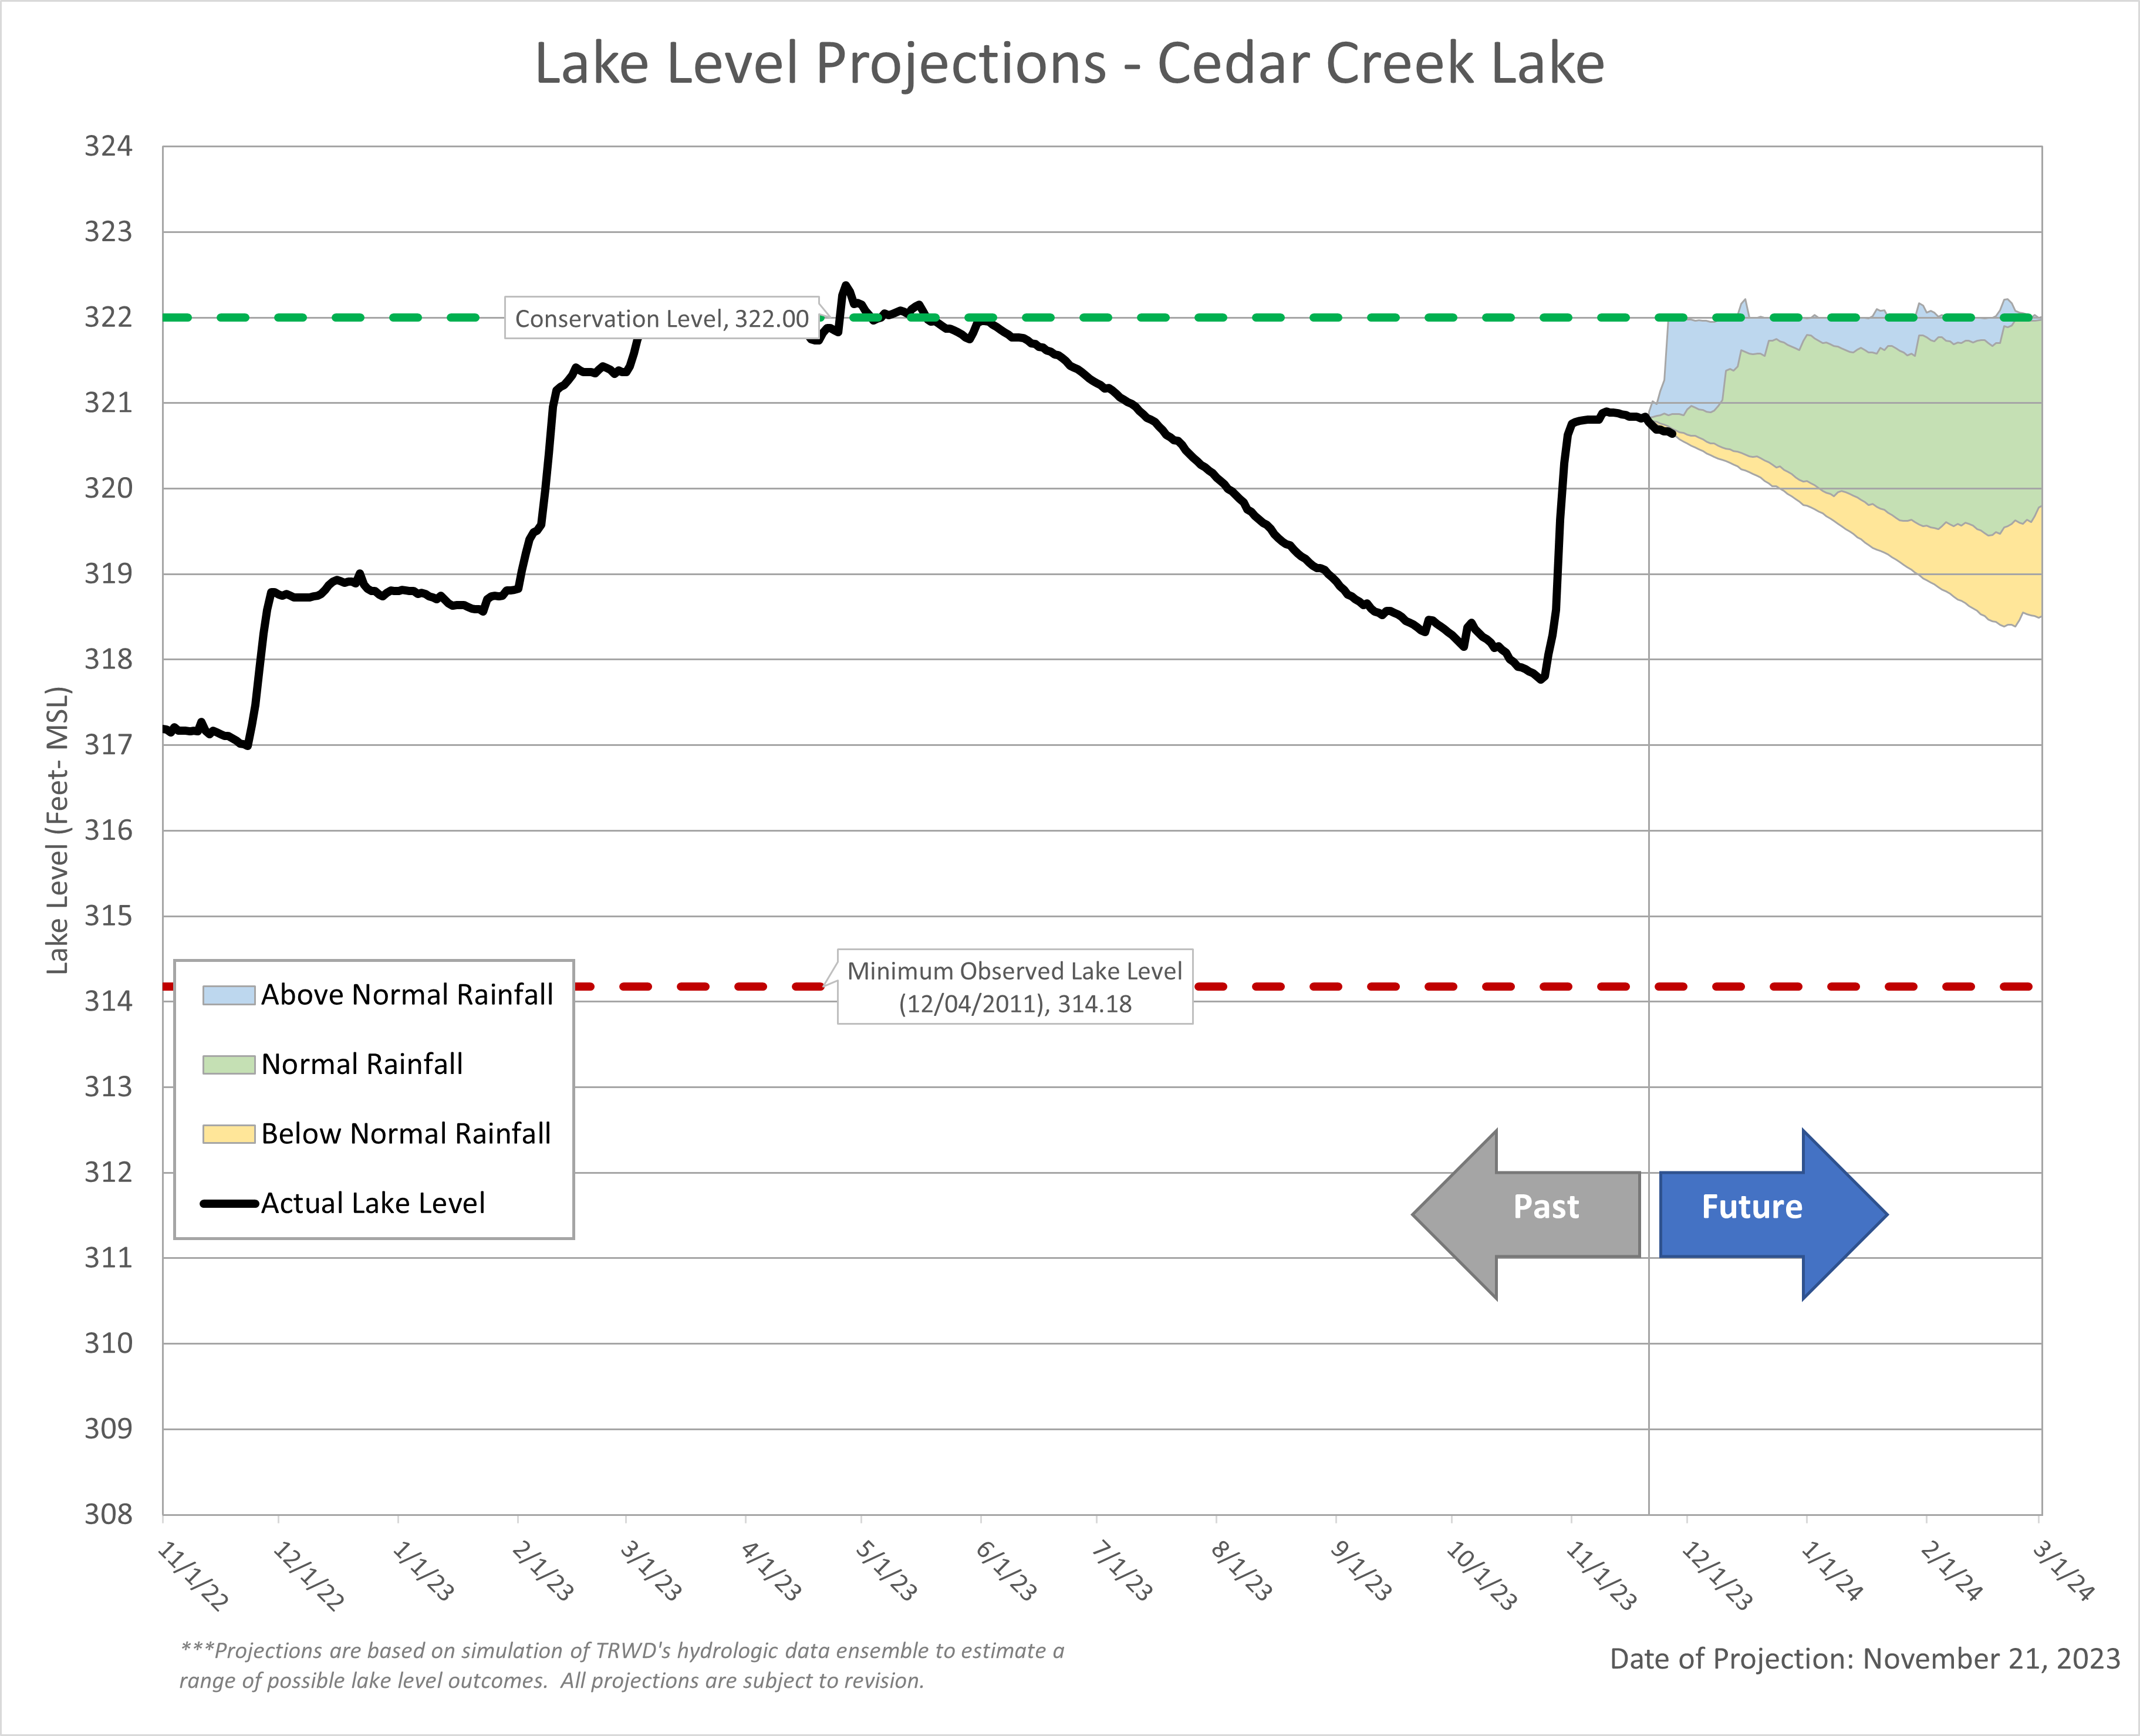
Cedar Creek Lake
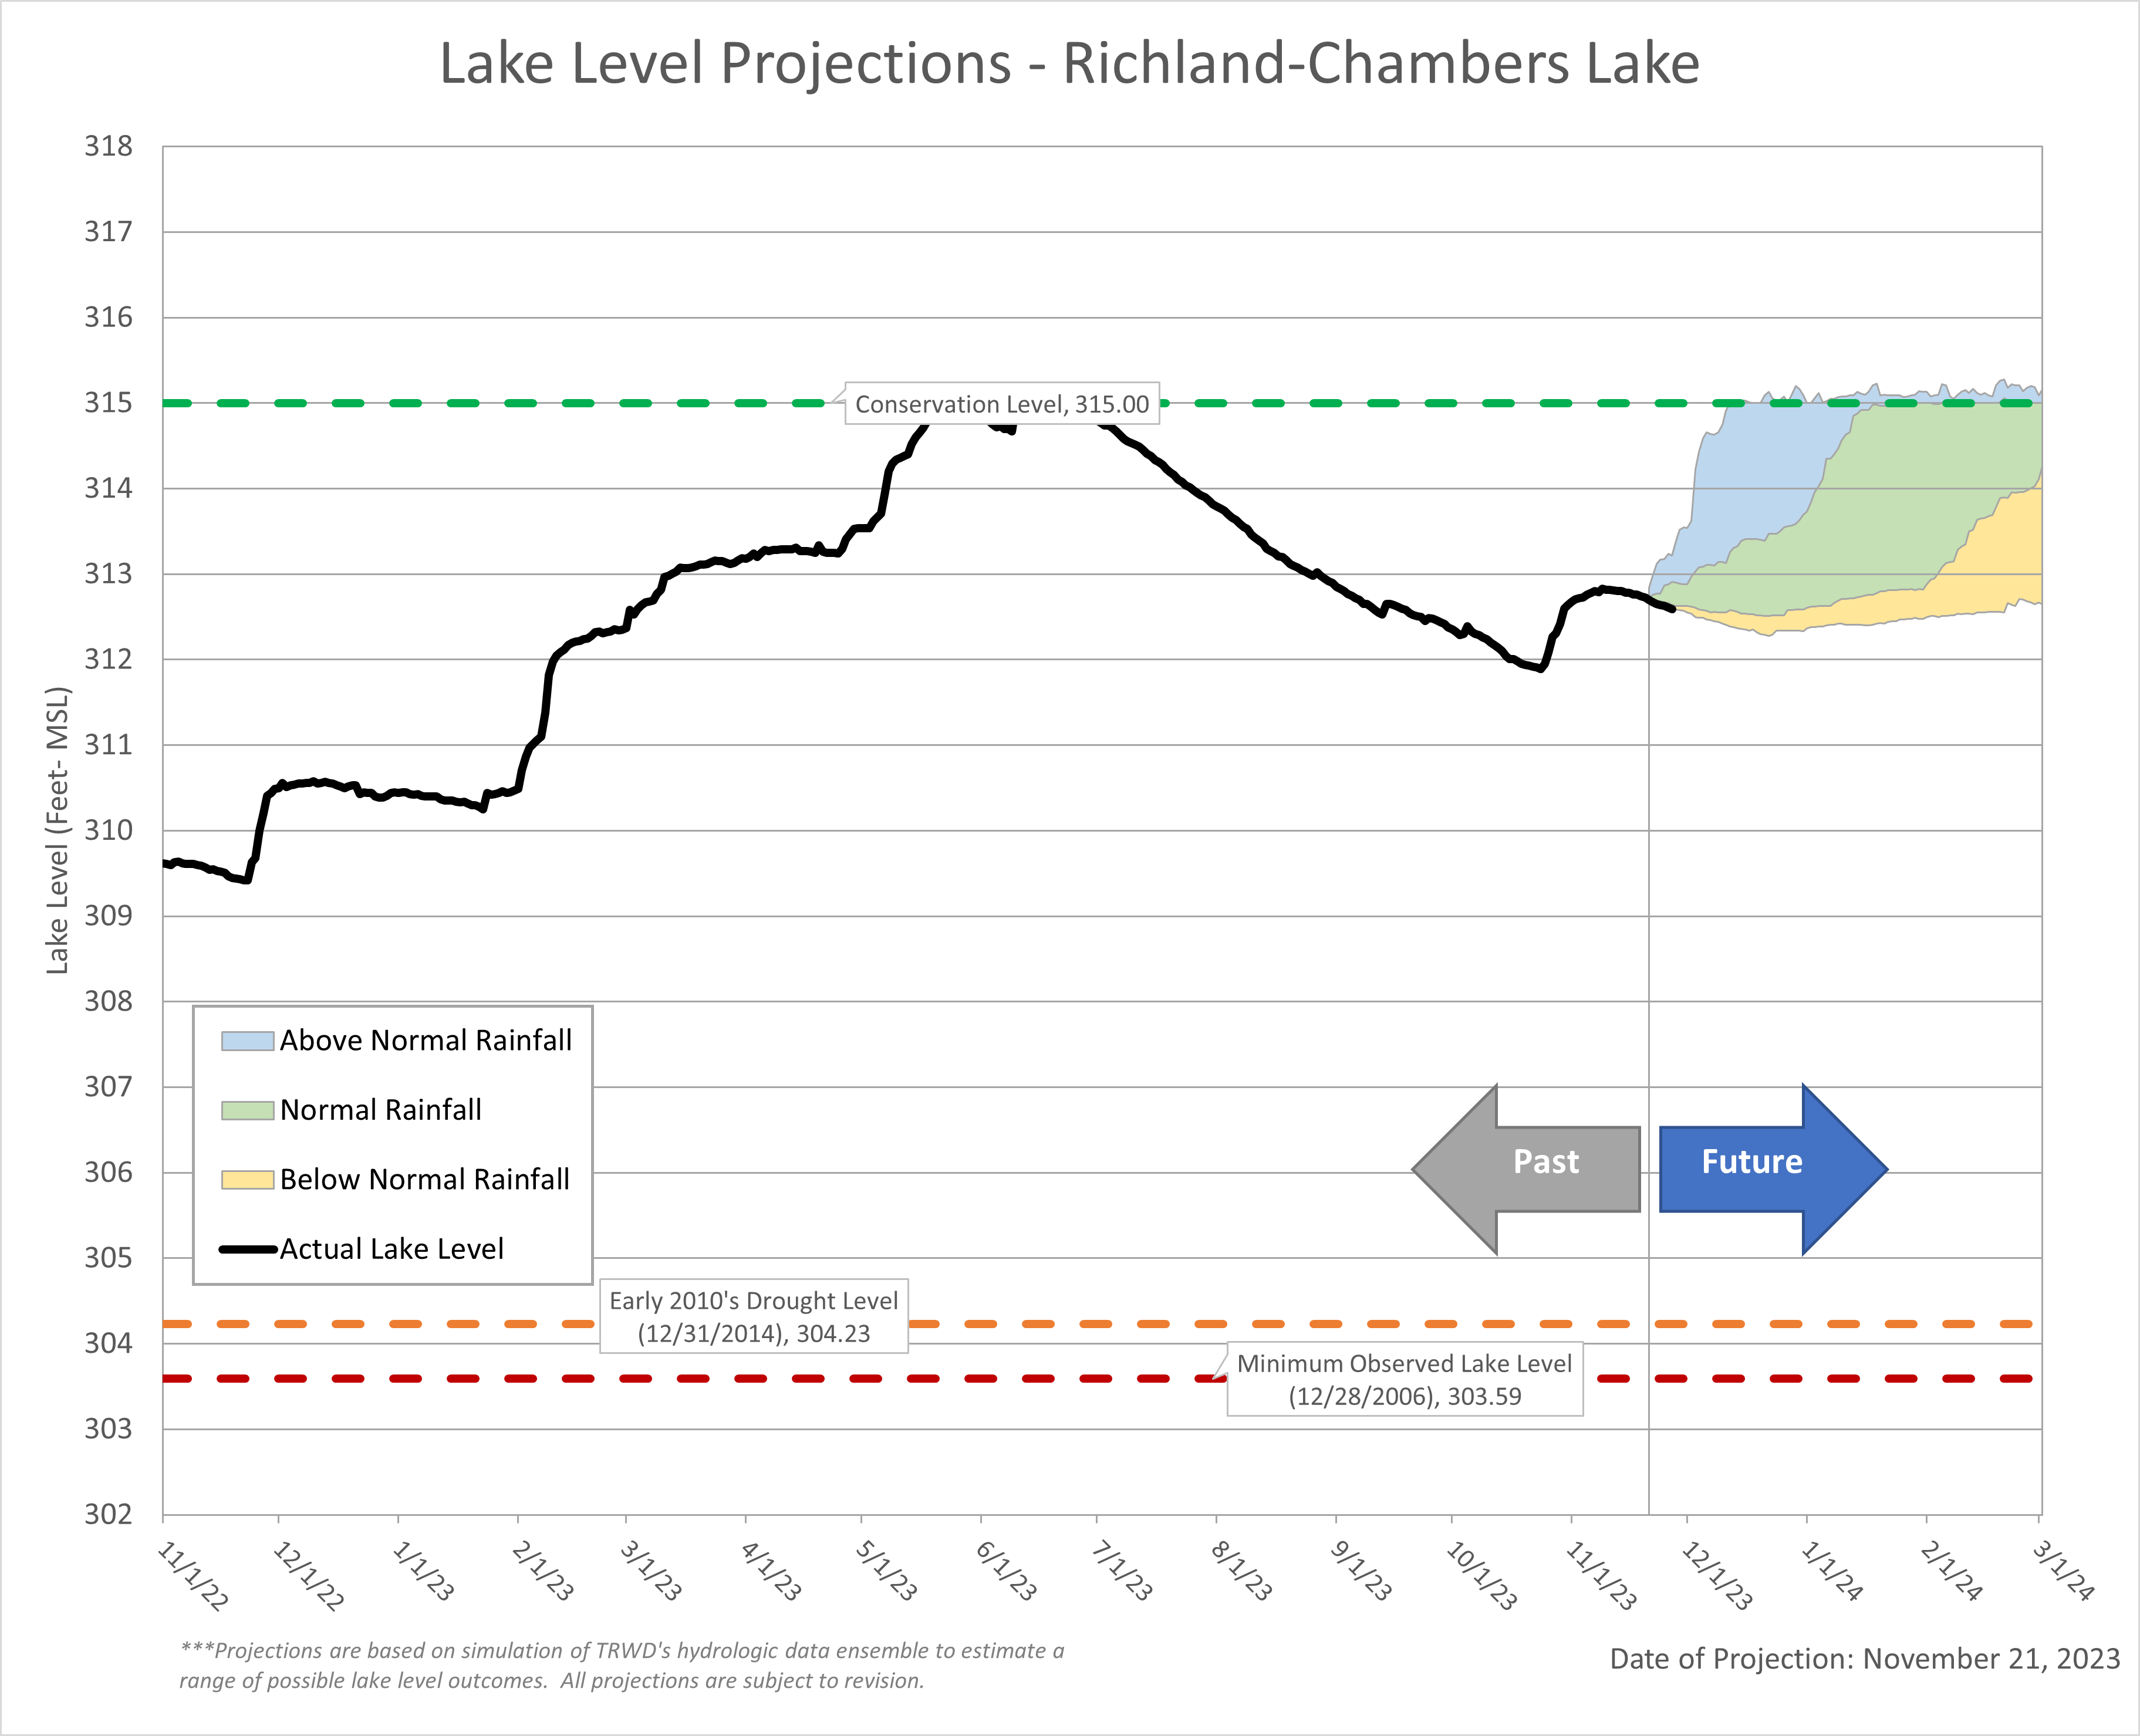
Richland-Chambers Lake
