September was warm and dry across the TRWD system. Despite the lack of rainfall, system storage only reduced by 3%, thanks in part to the above-average rainfall in August, which helped maintain higher storage levels. Currently, TRWD system storage is at 93% capacity. Both the West Fork (Bridgeport and Eagle Mountain) and East Texas (Cedar Creek and Richland-Chambers) systems remain at or above 90%.
Highlights:
- Temperature: September was warm with temperatures averaging 2.3 degrees above normal. Temperatures reached triple digits on September 4th, and the region had 20 days out of 30 above normal for the month.
- Rainfall: The TRWD reservoirs received 1.5″ to 2″ of rain in September. However, all lakes recorded below-normal rainfall levels. See the 30-Day Percent of Normal Rainfall map below.
- Drought Conditions: Due to the below normal rainfall in September, the drought intensity classifications have increased in the North Texas region, as seen on the latest NWS Drought Monitor. Parts of TRWD’s West Fork shifted from the ‘none’ category to D0, indicating abnormally dry conditions. The Richland Chambers and Cedar Creek watersheds remain mostly in the “none” category but that may change with the forecast ahead.
Looking Ahead:
- October Forecast: October is forecasted to be warm and dry, with the 1-Month Outlook showing above-normal temperatures and below-normal rainfall.
- Extended Outlook: A warmer trend is expected in the coming months as seen in the latest climate models for the Oct-Nov-Dec Temperature Outlook. Rainfall is expected to be below normal or slightly below normal as shown in the Oct-Nov-Dec Precipitation Outlook. This is due to the expected transition from ENSO-neutral conditions to La Niña.
Note: ENSO, or the El Niño-Southern Oscillation, is a recurring climate pattern that influences global weather. It has two main phases: El Niño, which often brings wetter conditions, and La Niña, which typically leads to drier and warmer weather in Texas, especially during fall and winter. This shift is important for water resource planning, as it can affect rainfall and reservoir levels.
Stay Informed by Checking Out the Following:
- The latest lake level projections (see below).
- Links to historical lake level plots.
- Past projections compared to actual outcomes.
Thank you for following the Lake Level Blog. Check back next month for more updates!
TRWD Watershed Rainfall
30-Day Percent of Normal Rainfall
TRWD Lake Rainfall Totals through September 30, 2025
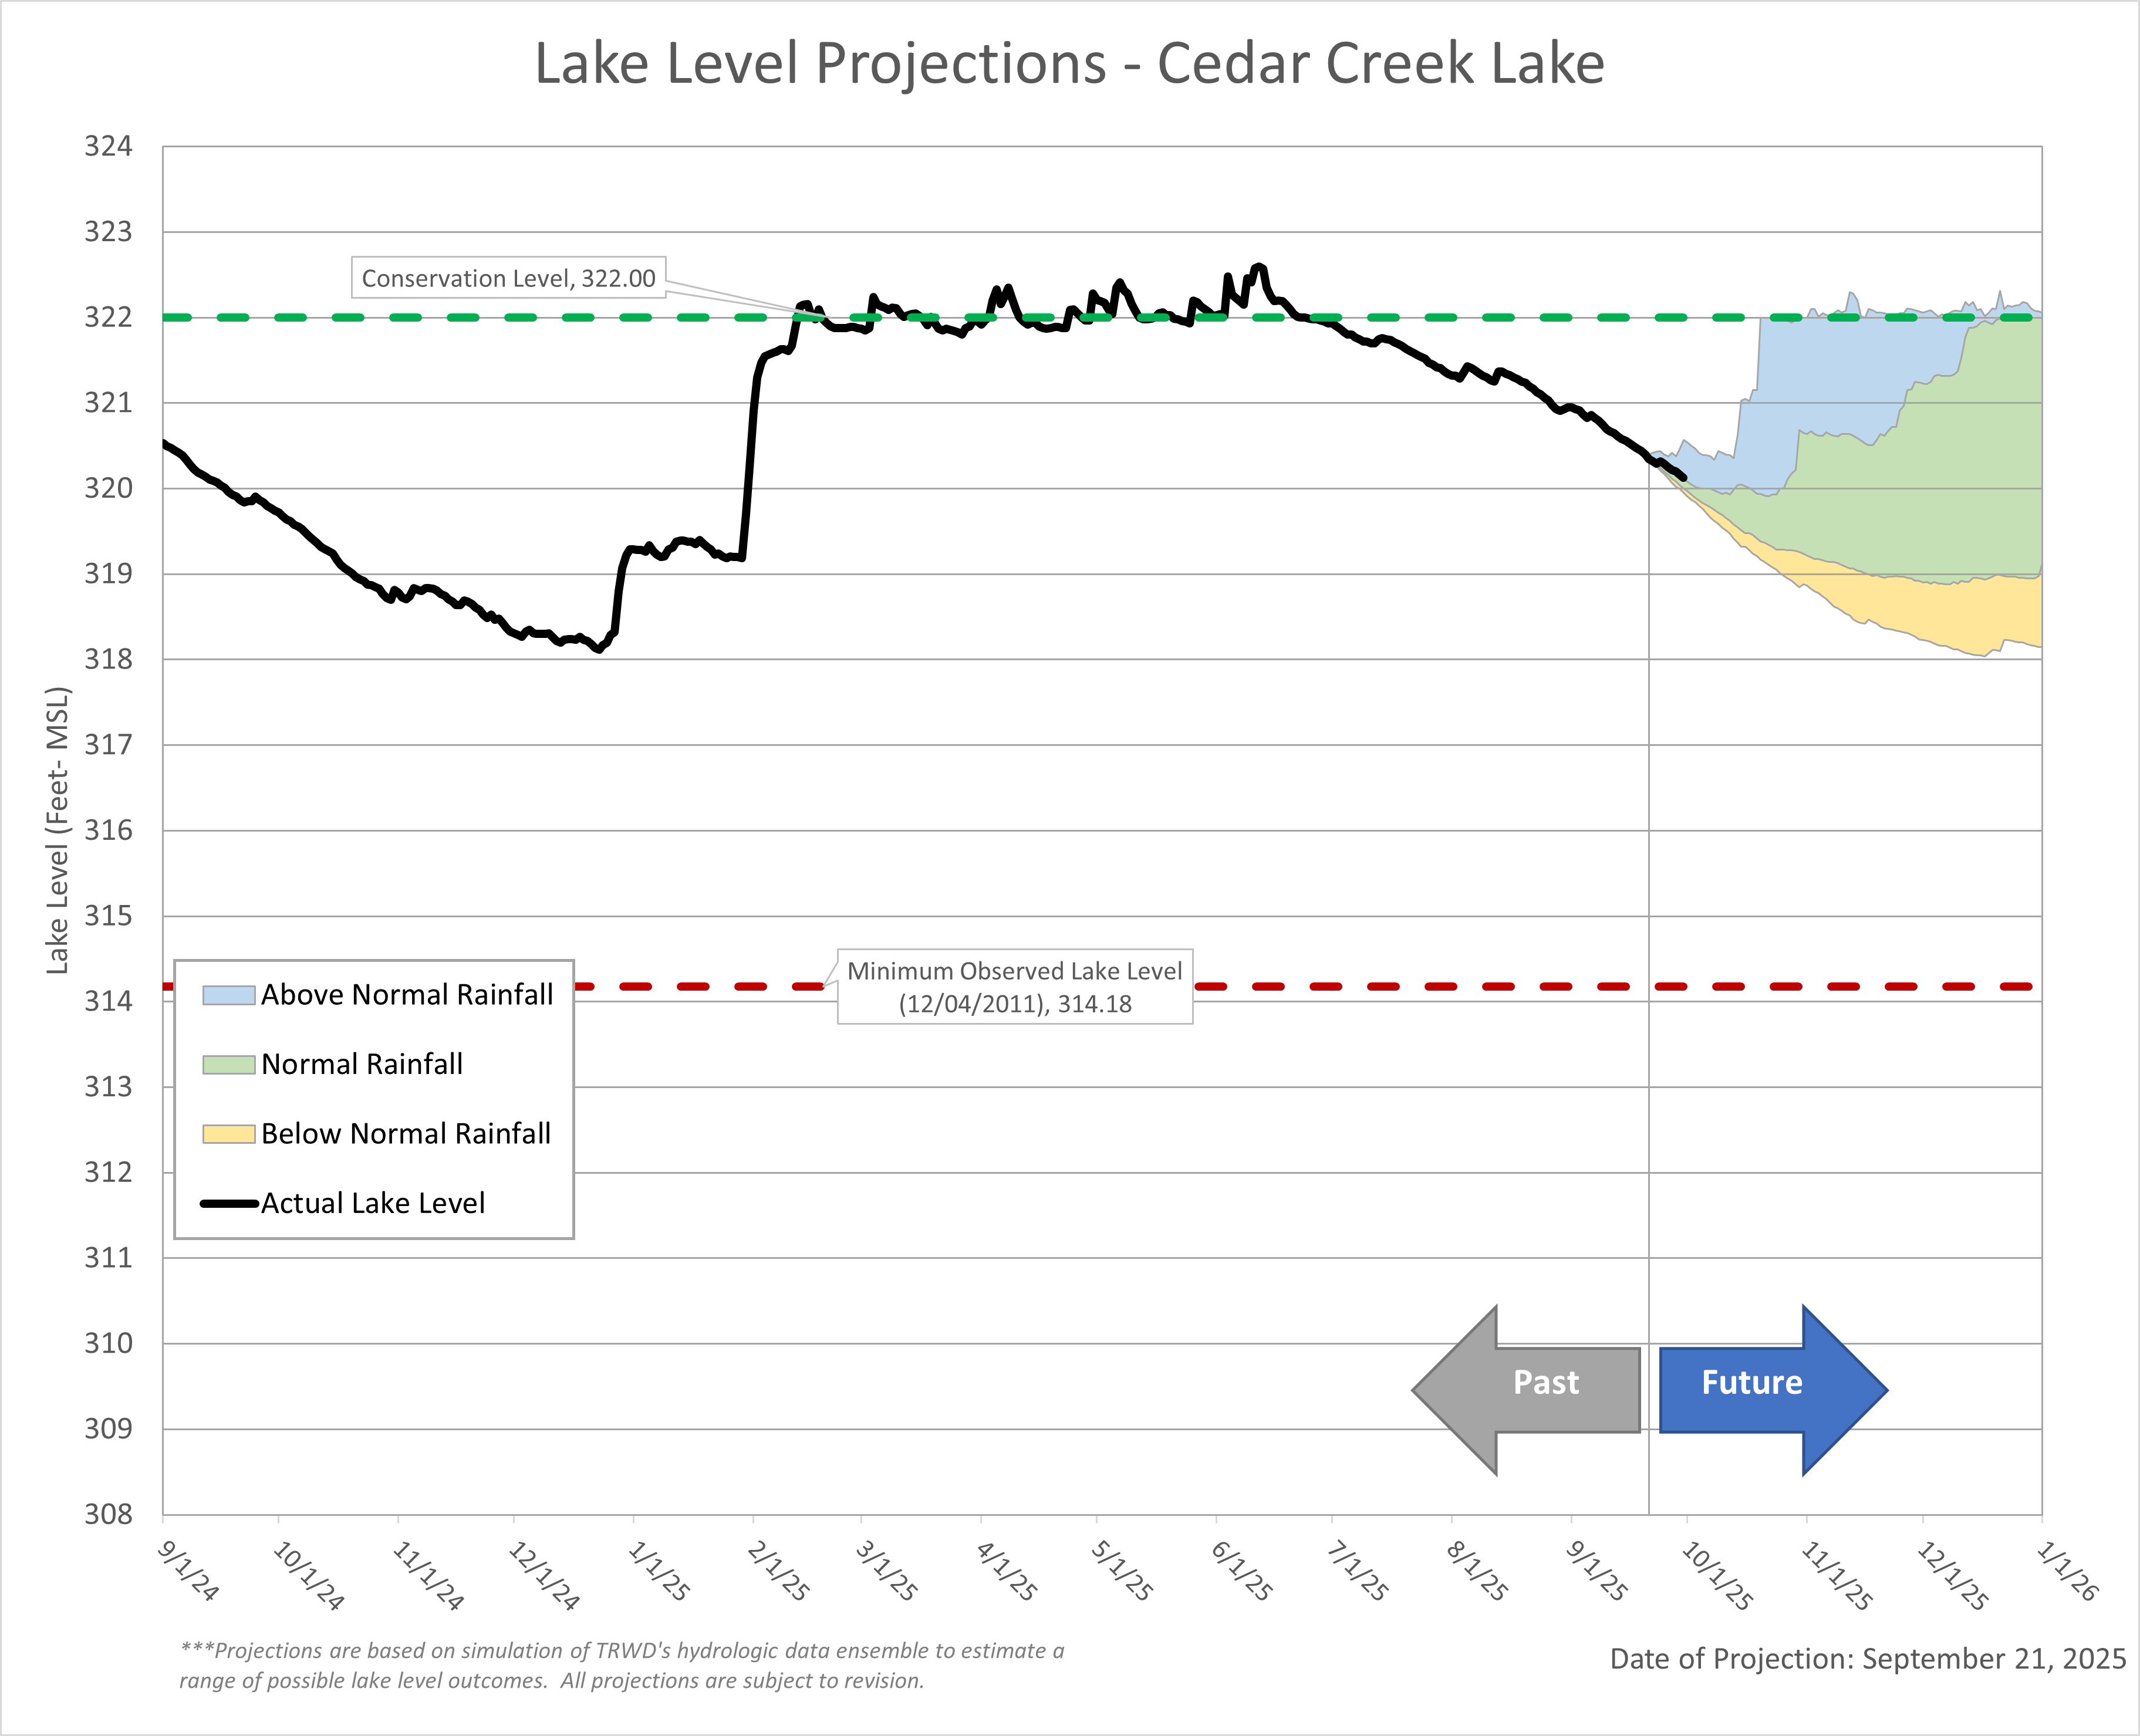
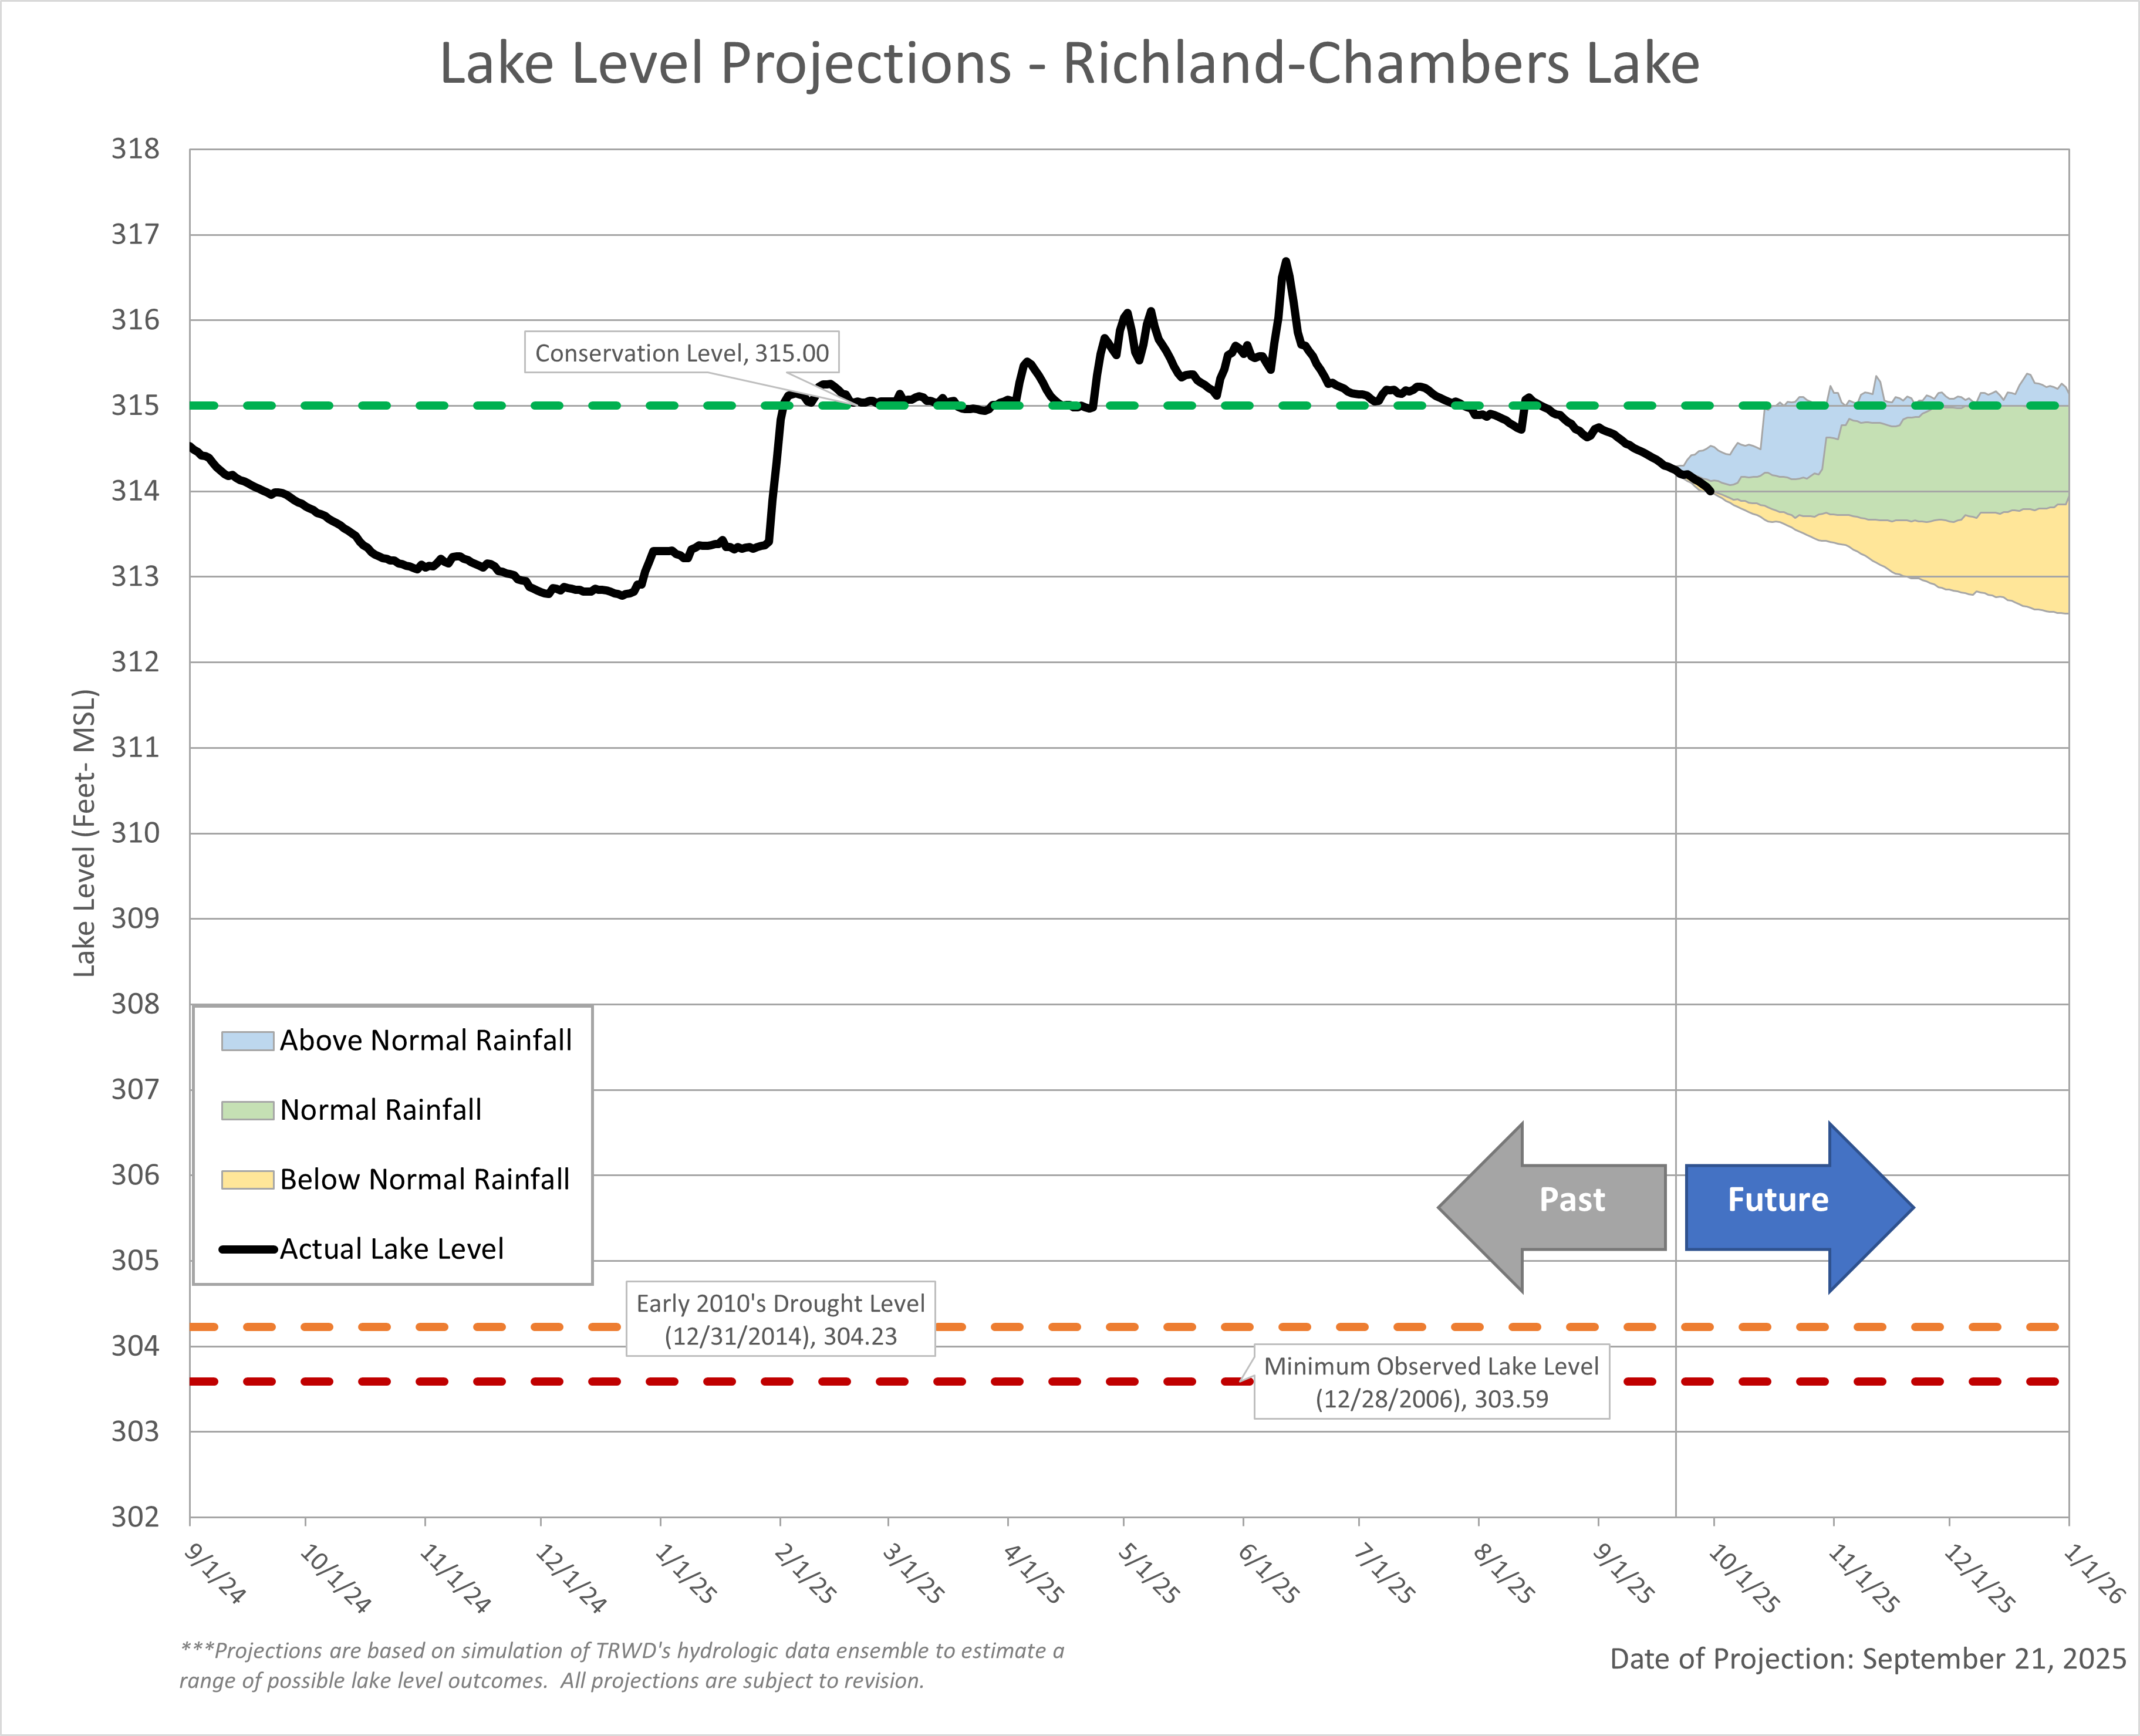
Lake Level Projections
Lake Bridgeport
Eagle Mountain Lake
Cedar Creek Lake
Richland-Chambers Lake
Acknowledgments:
- Weather Insights: Special thanks to Courtney Jalbert, TRWD’s Meteorologist, for providing detailed weather insights and forecasts.
- Reservoir Projections: A big thank you to Vini de Oliveira for his timely reservoir projections.
- Rainfall Analysis: Appreciation goes to Ashley Lowrie for her thorough analysis of observed rainfall.
- Editorial Review: Special thanks to Victoria Cason for her thorough editorial review.