Overall, July brought above-average rainfall to much of the TRWD service area. This helped maintain TRWD system storage at higher levels as we move into the peak of summer. Currently, TRWD system storage stands at 98% capacity, with both the West Fork (Bridgeport and Eagle Mountain) and East Texas (Cedar Creek and Richland-Chambers) systems nearly full.
Highlights:
- Temperature: July temperatures were slightly below normal, mostly due to cold fronts that brought intermittent rainstorms throughout the month.
- Rainfall: July rainfall was above normal for most of the TRWD service area, except for the West Fork lakes. See the 30-Day Percent of Normal Rainfall map below.
- Drought Conditions: Due to the excess rainfall over the past few months, most of Texas is currently free of drought, according to the NWS Drought Monitor.
Looking Ahead:
- August Forecast: August temperatures are expected to be slightly above normal with equal chances of near-normal rainfall.
- Summer Outlook: Currently, ENSO conditions are neutral and expected to persist through the summer, but there’s a chance of a shift toward La Niña in the fall/winter months. Equal chances of near-normal precipitation and warmer than normal conditions are currently predicted for the next three months.
Stay Informed by Checking Out the Following:
- The latest lake level projections (see below).
- Links to historical lake level plots.
- Past projections compared to actual outcomes.
Thank you for following the Lake Level Blog. Check back next month for more updates!
TRWD Watershed Rainfall
30-Day Rainfall Totals
TRWD Lake Rainfall Totals through July 31, 2025
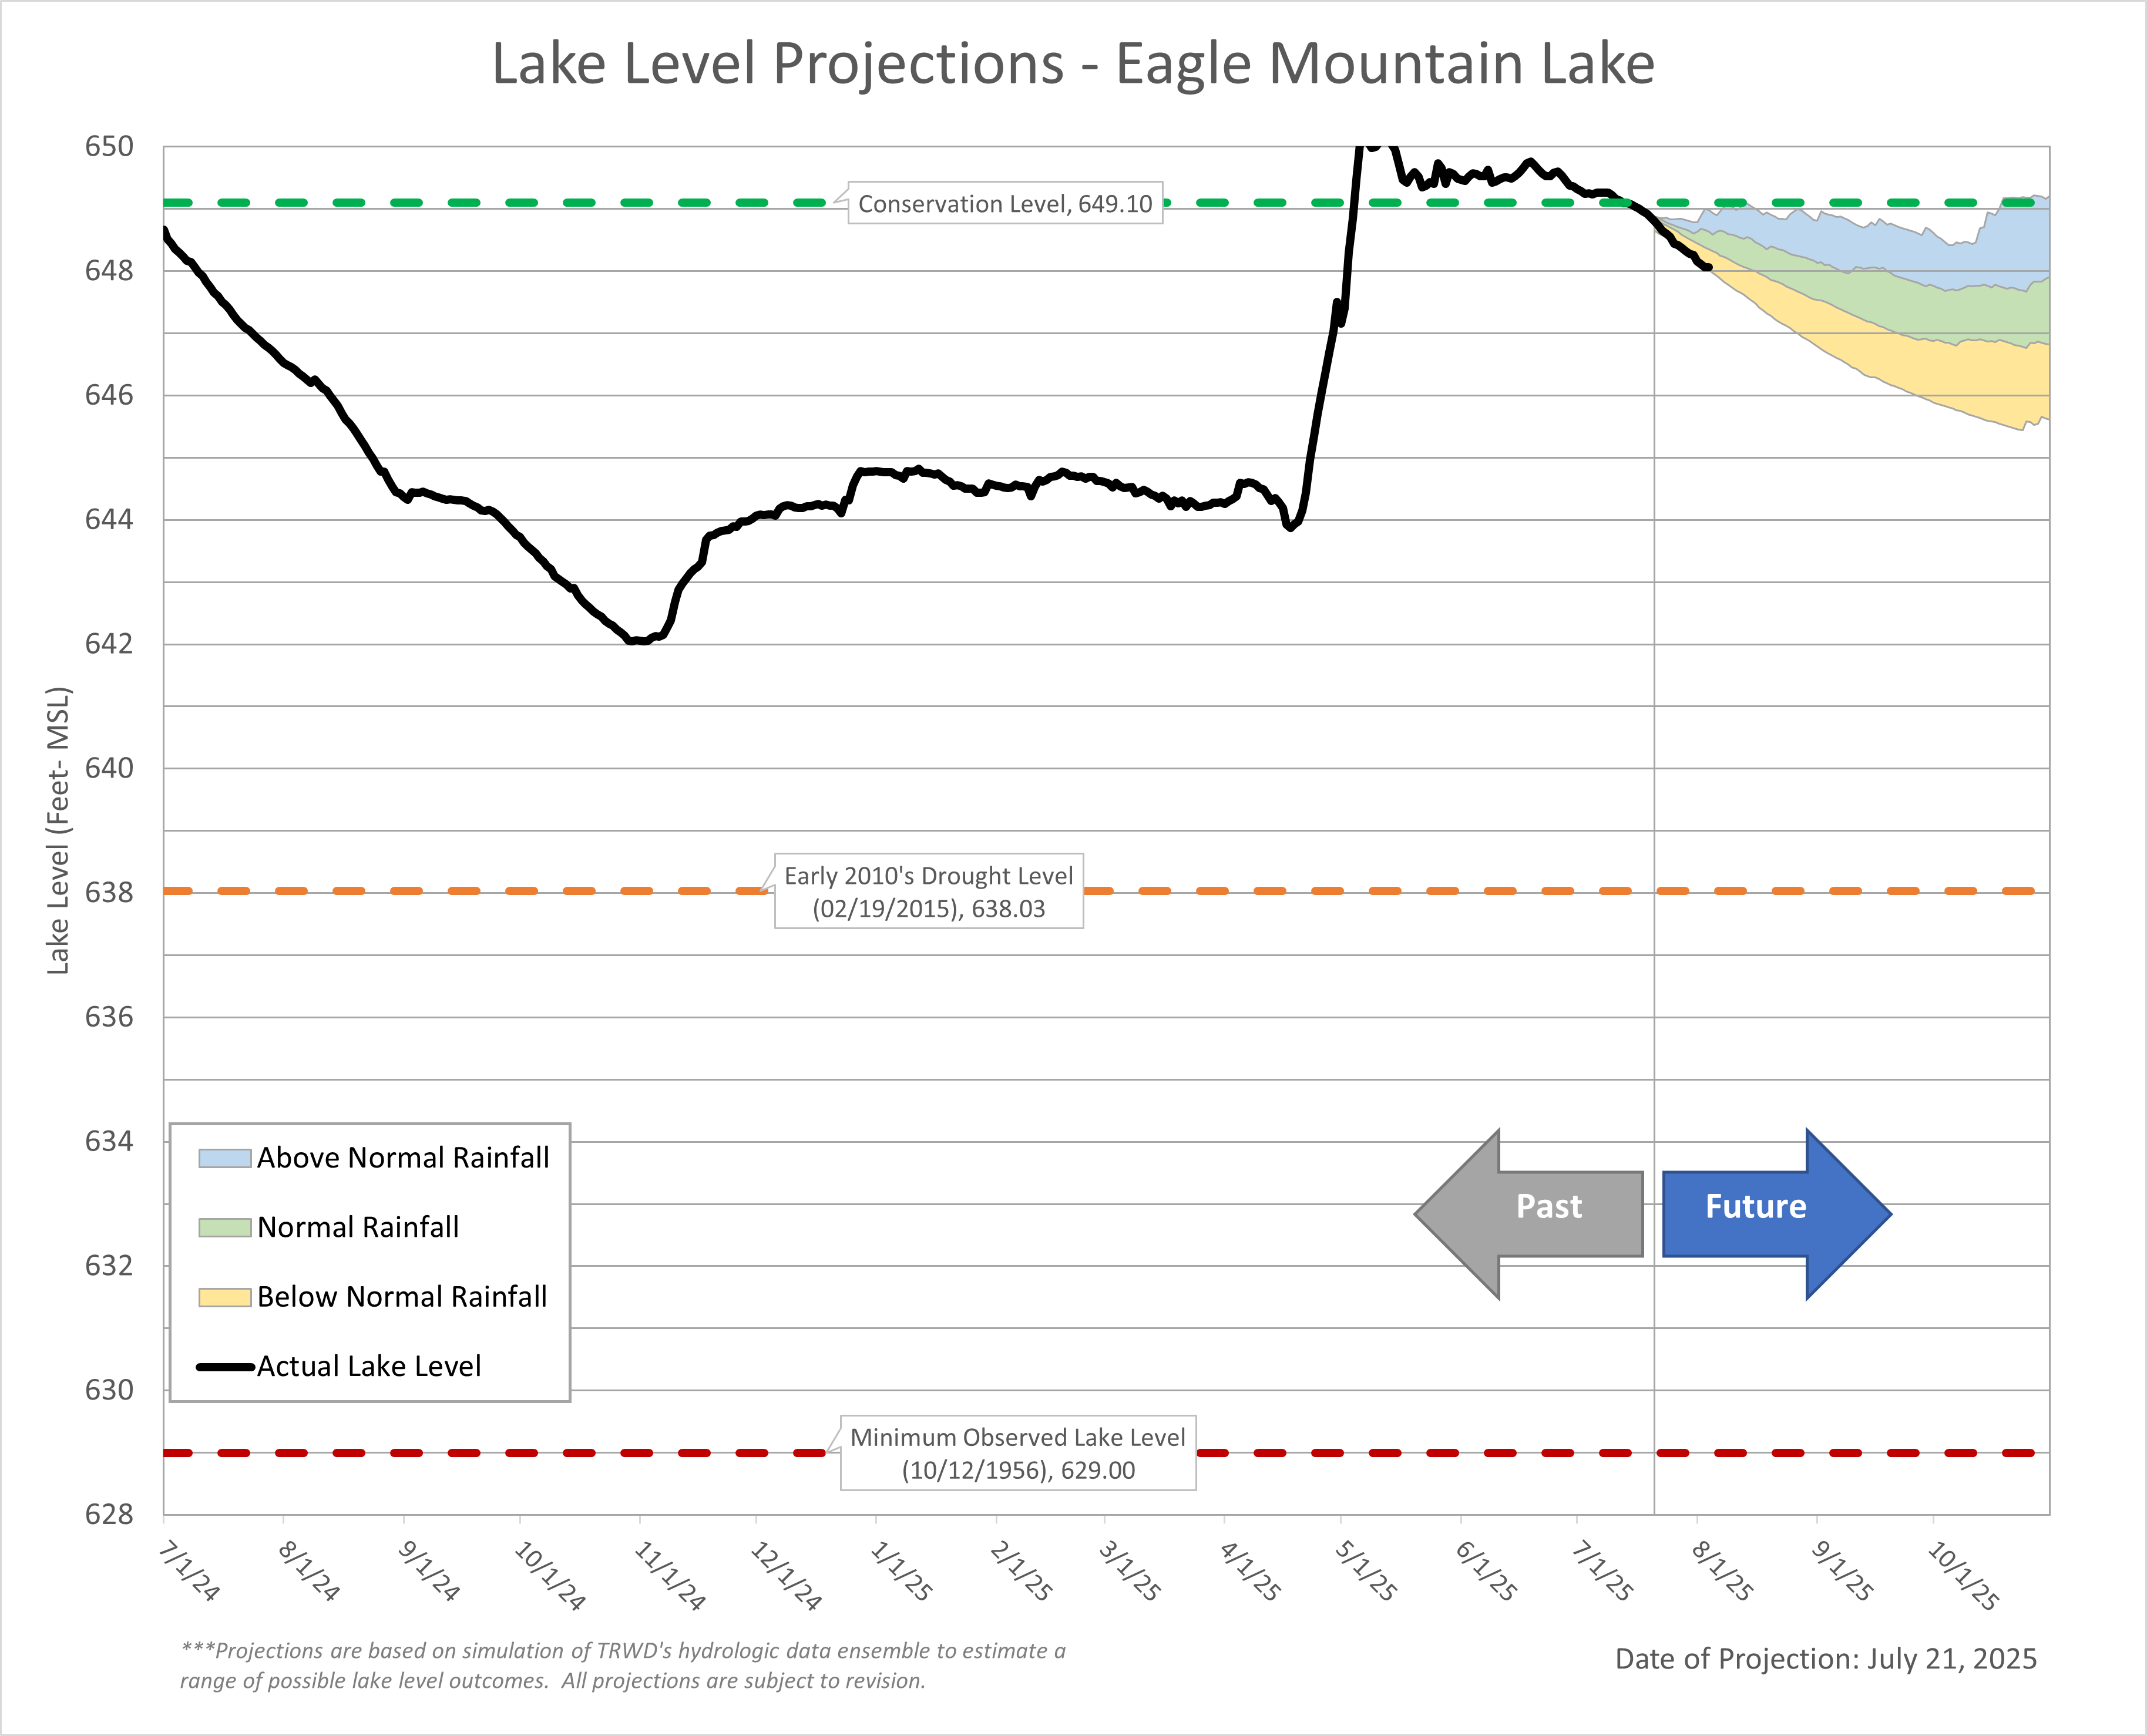
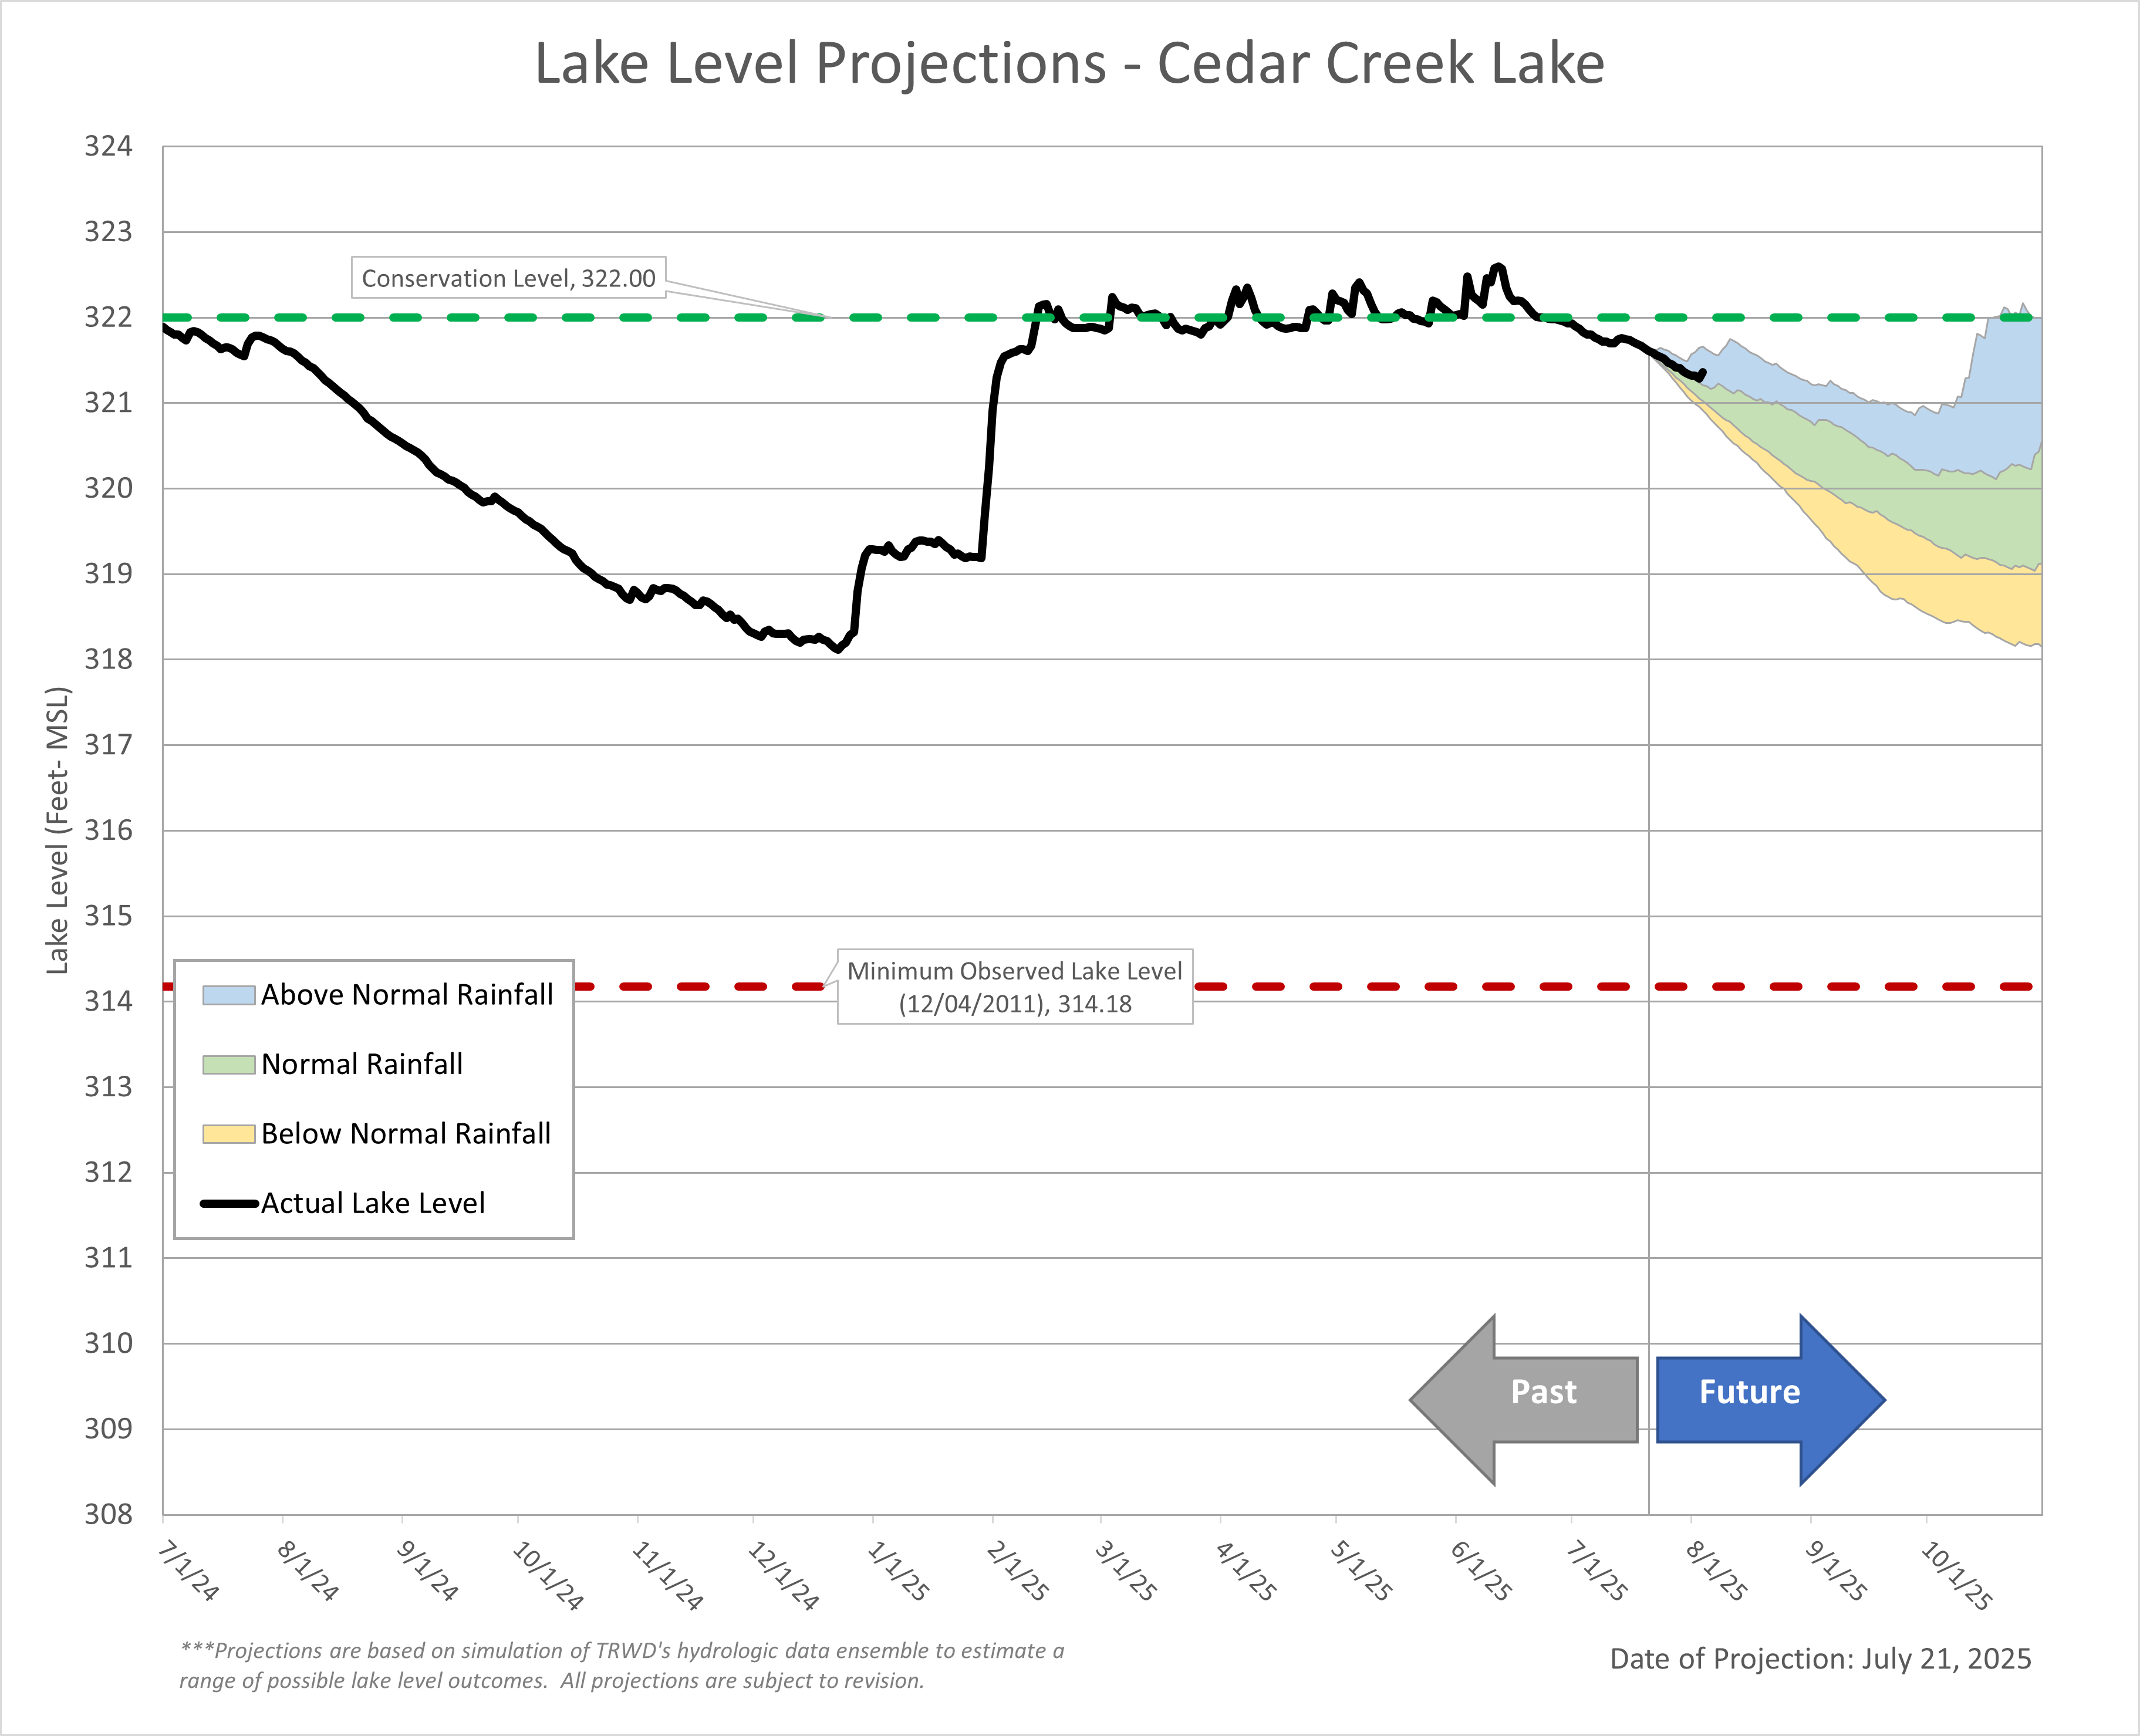
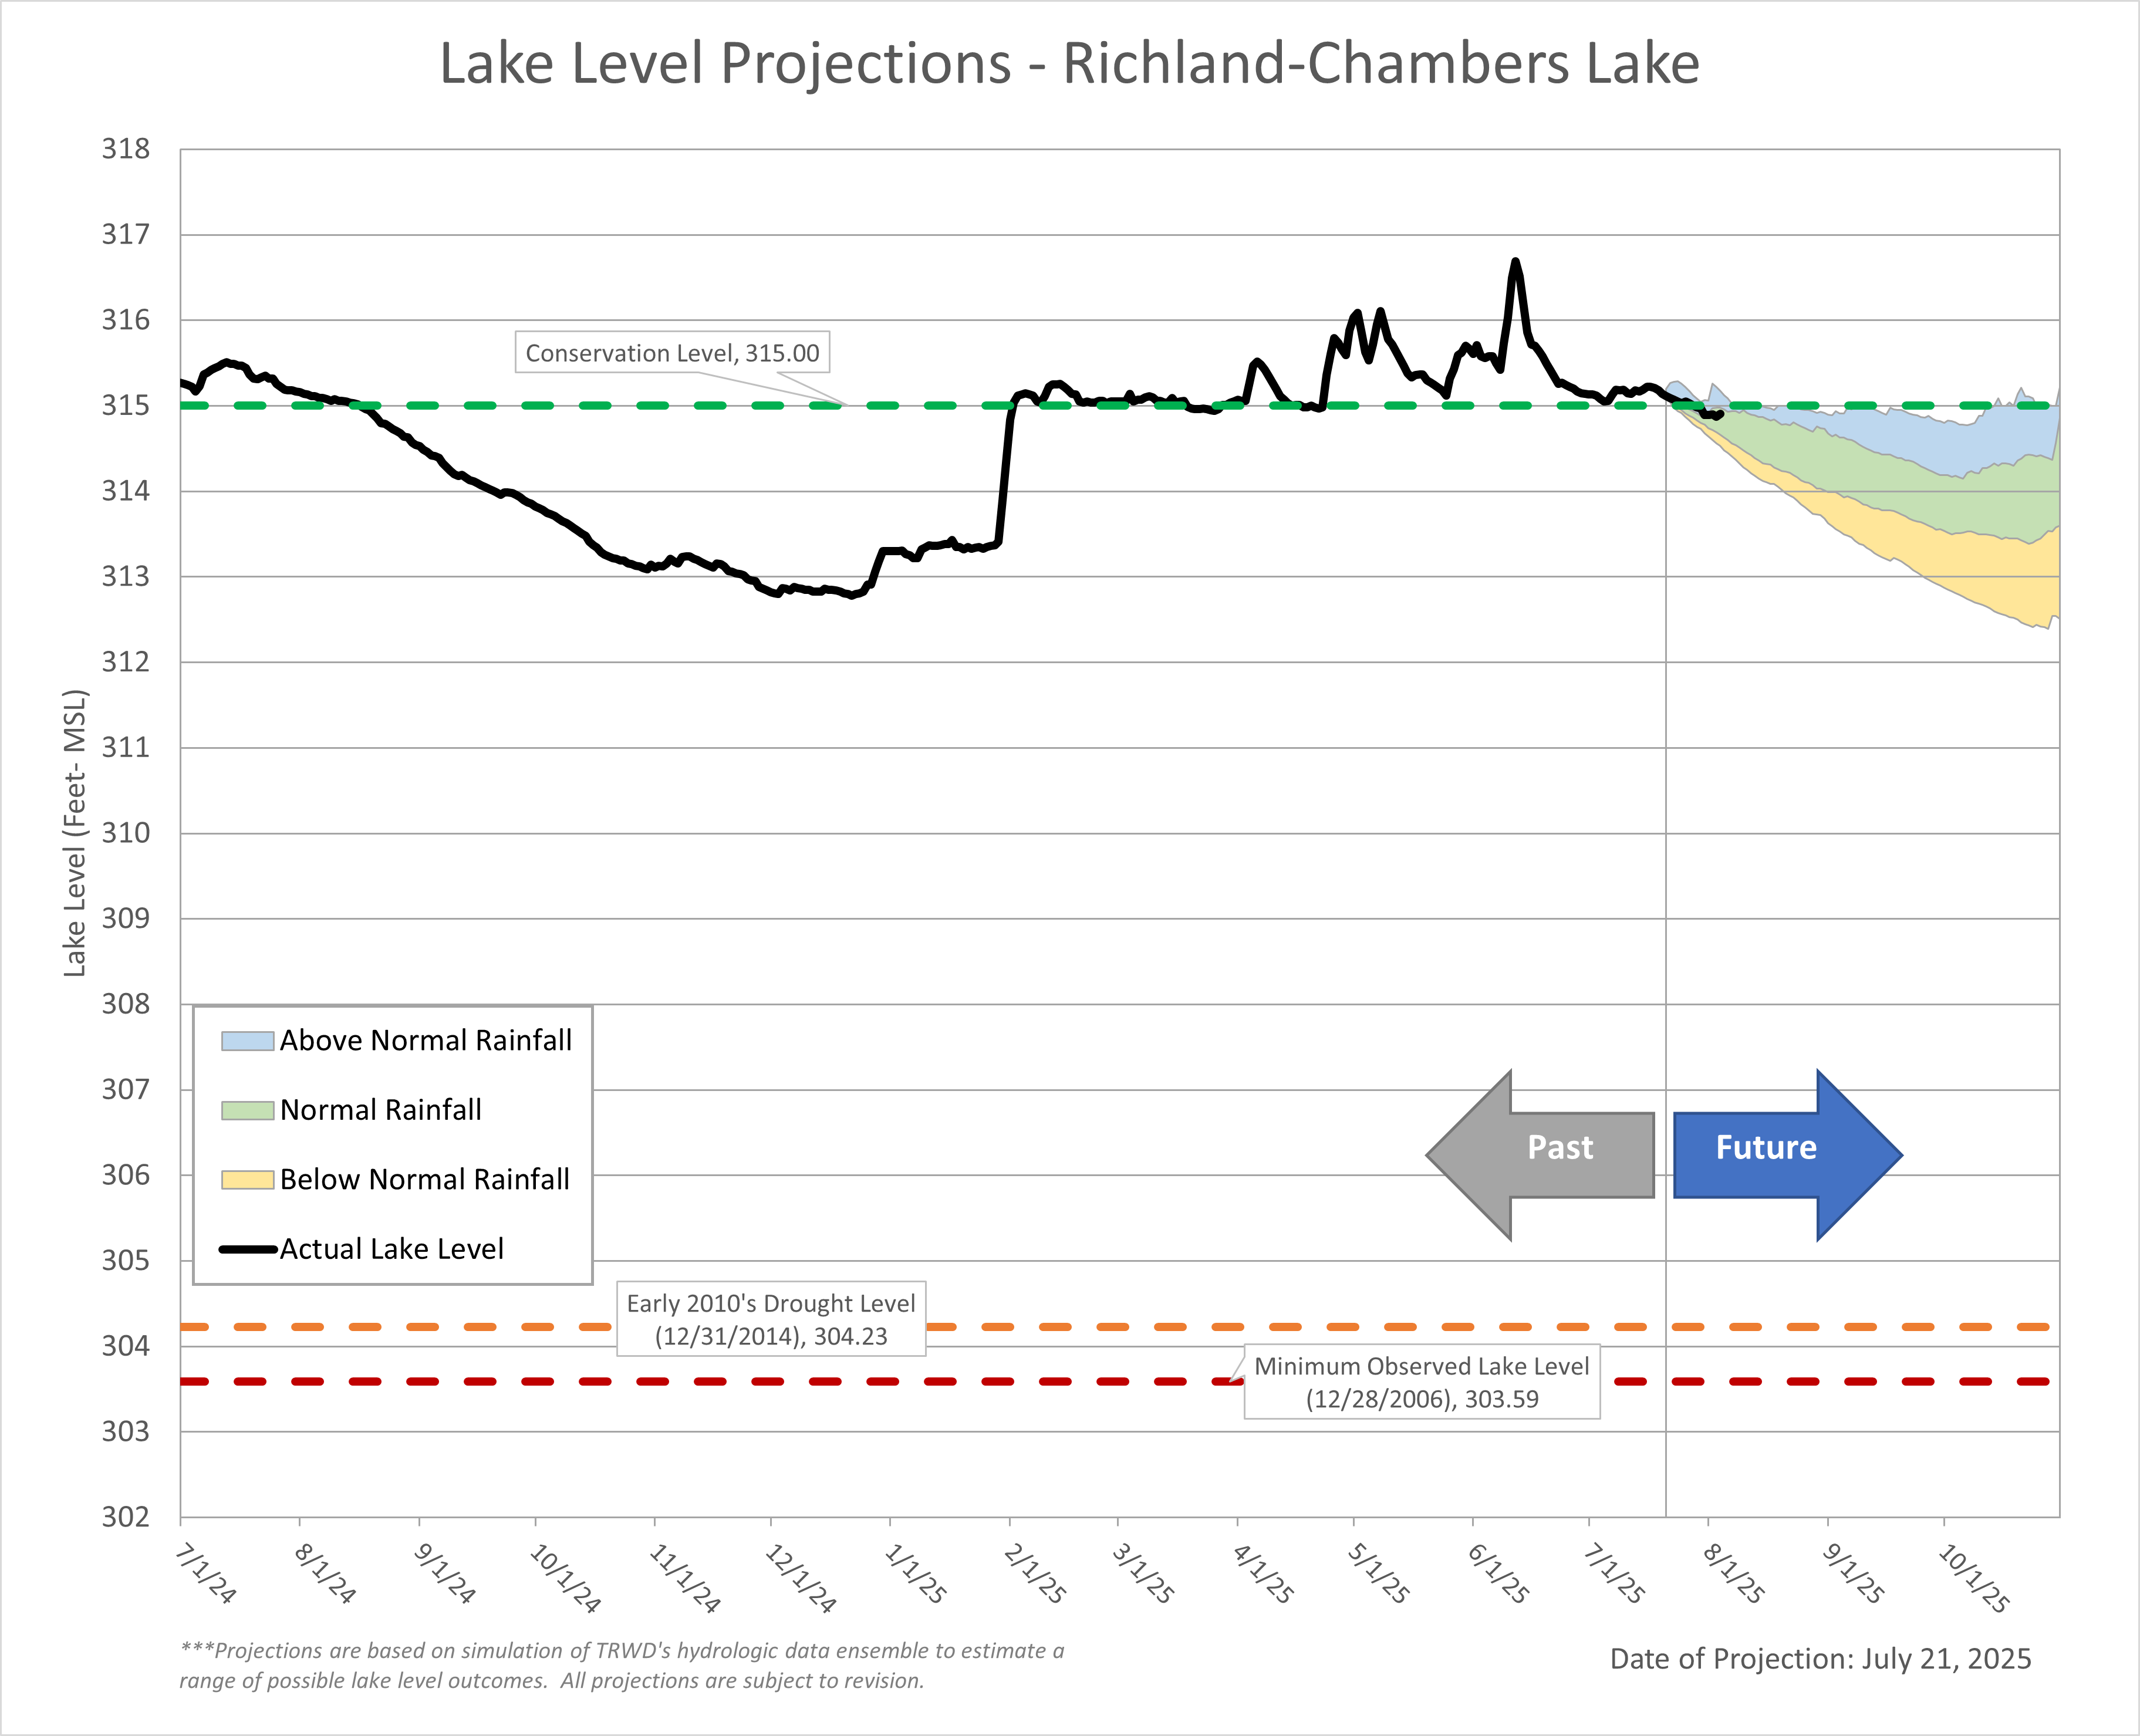
Lake Level Projection
Lake Bridgeport
Eagle Mountain Lake
Cedar Creek Lake
Richland-Chambers Lake
Acknowledgments:
- Weather Insights: Special thanks to Courtney Jalbert, TRWD’s Meteorologist, for providing detailed weather insights and forecasts.
- Reservoir Projections: A big thank you to Vini de Oliveira for his timely reservoir projections.
- Rainfall Analysis: Appreciation goes to Ashley Lowrie for her thorough analysis of observed rainfall.