The latest lake level projections are shown below. You will also find:
- Links to historical lake level plots
- Last month’s projections compared to what actually happened
Even though February was dry, the rainfall received in the TRWD watersheds in the past few months have helped maintain the system storage at a high level. Going forward, March is expected to be at or above normal precipitation. TRWD’s Meteorologist, Courtney Jalbert, provides discussion on what we can expect in terms of rainfall adding water to the lakes in the “From our Meteorologist” section.
Thank you for following the Lake Level Blog and check back next month about this time for more projections.
From our Meteorologist
February Summary…
February 2024 has been much warmer and drier than previous years. Temperatures have been 6 to 8 degrees above normal and precipitation has been sparse with totals only reaching around 1.88” at DFW airport, which is 0.64” below normal as of February 27th. Notably, February 26th saw parts of North Texas hit high temperatures in the mid-90s. Most of the region has seen between 50 to 75% of the normal precipitation over the last 30 days (30-Day Percent Precipitation Map). See the past 30 days totals below.
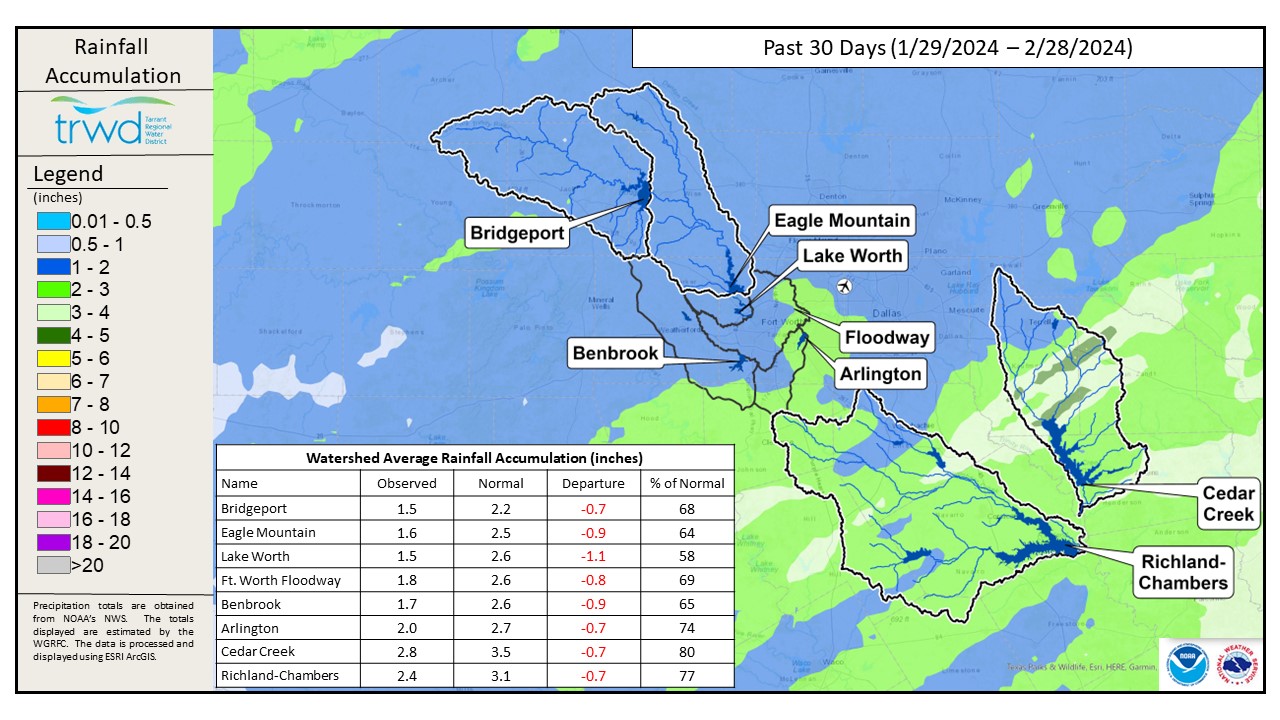
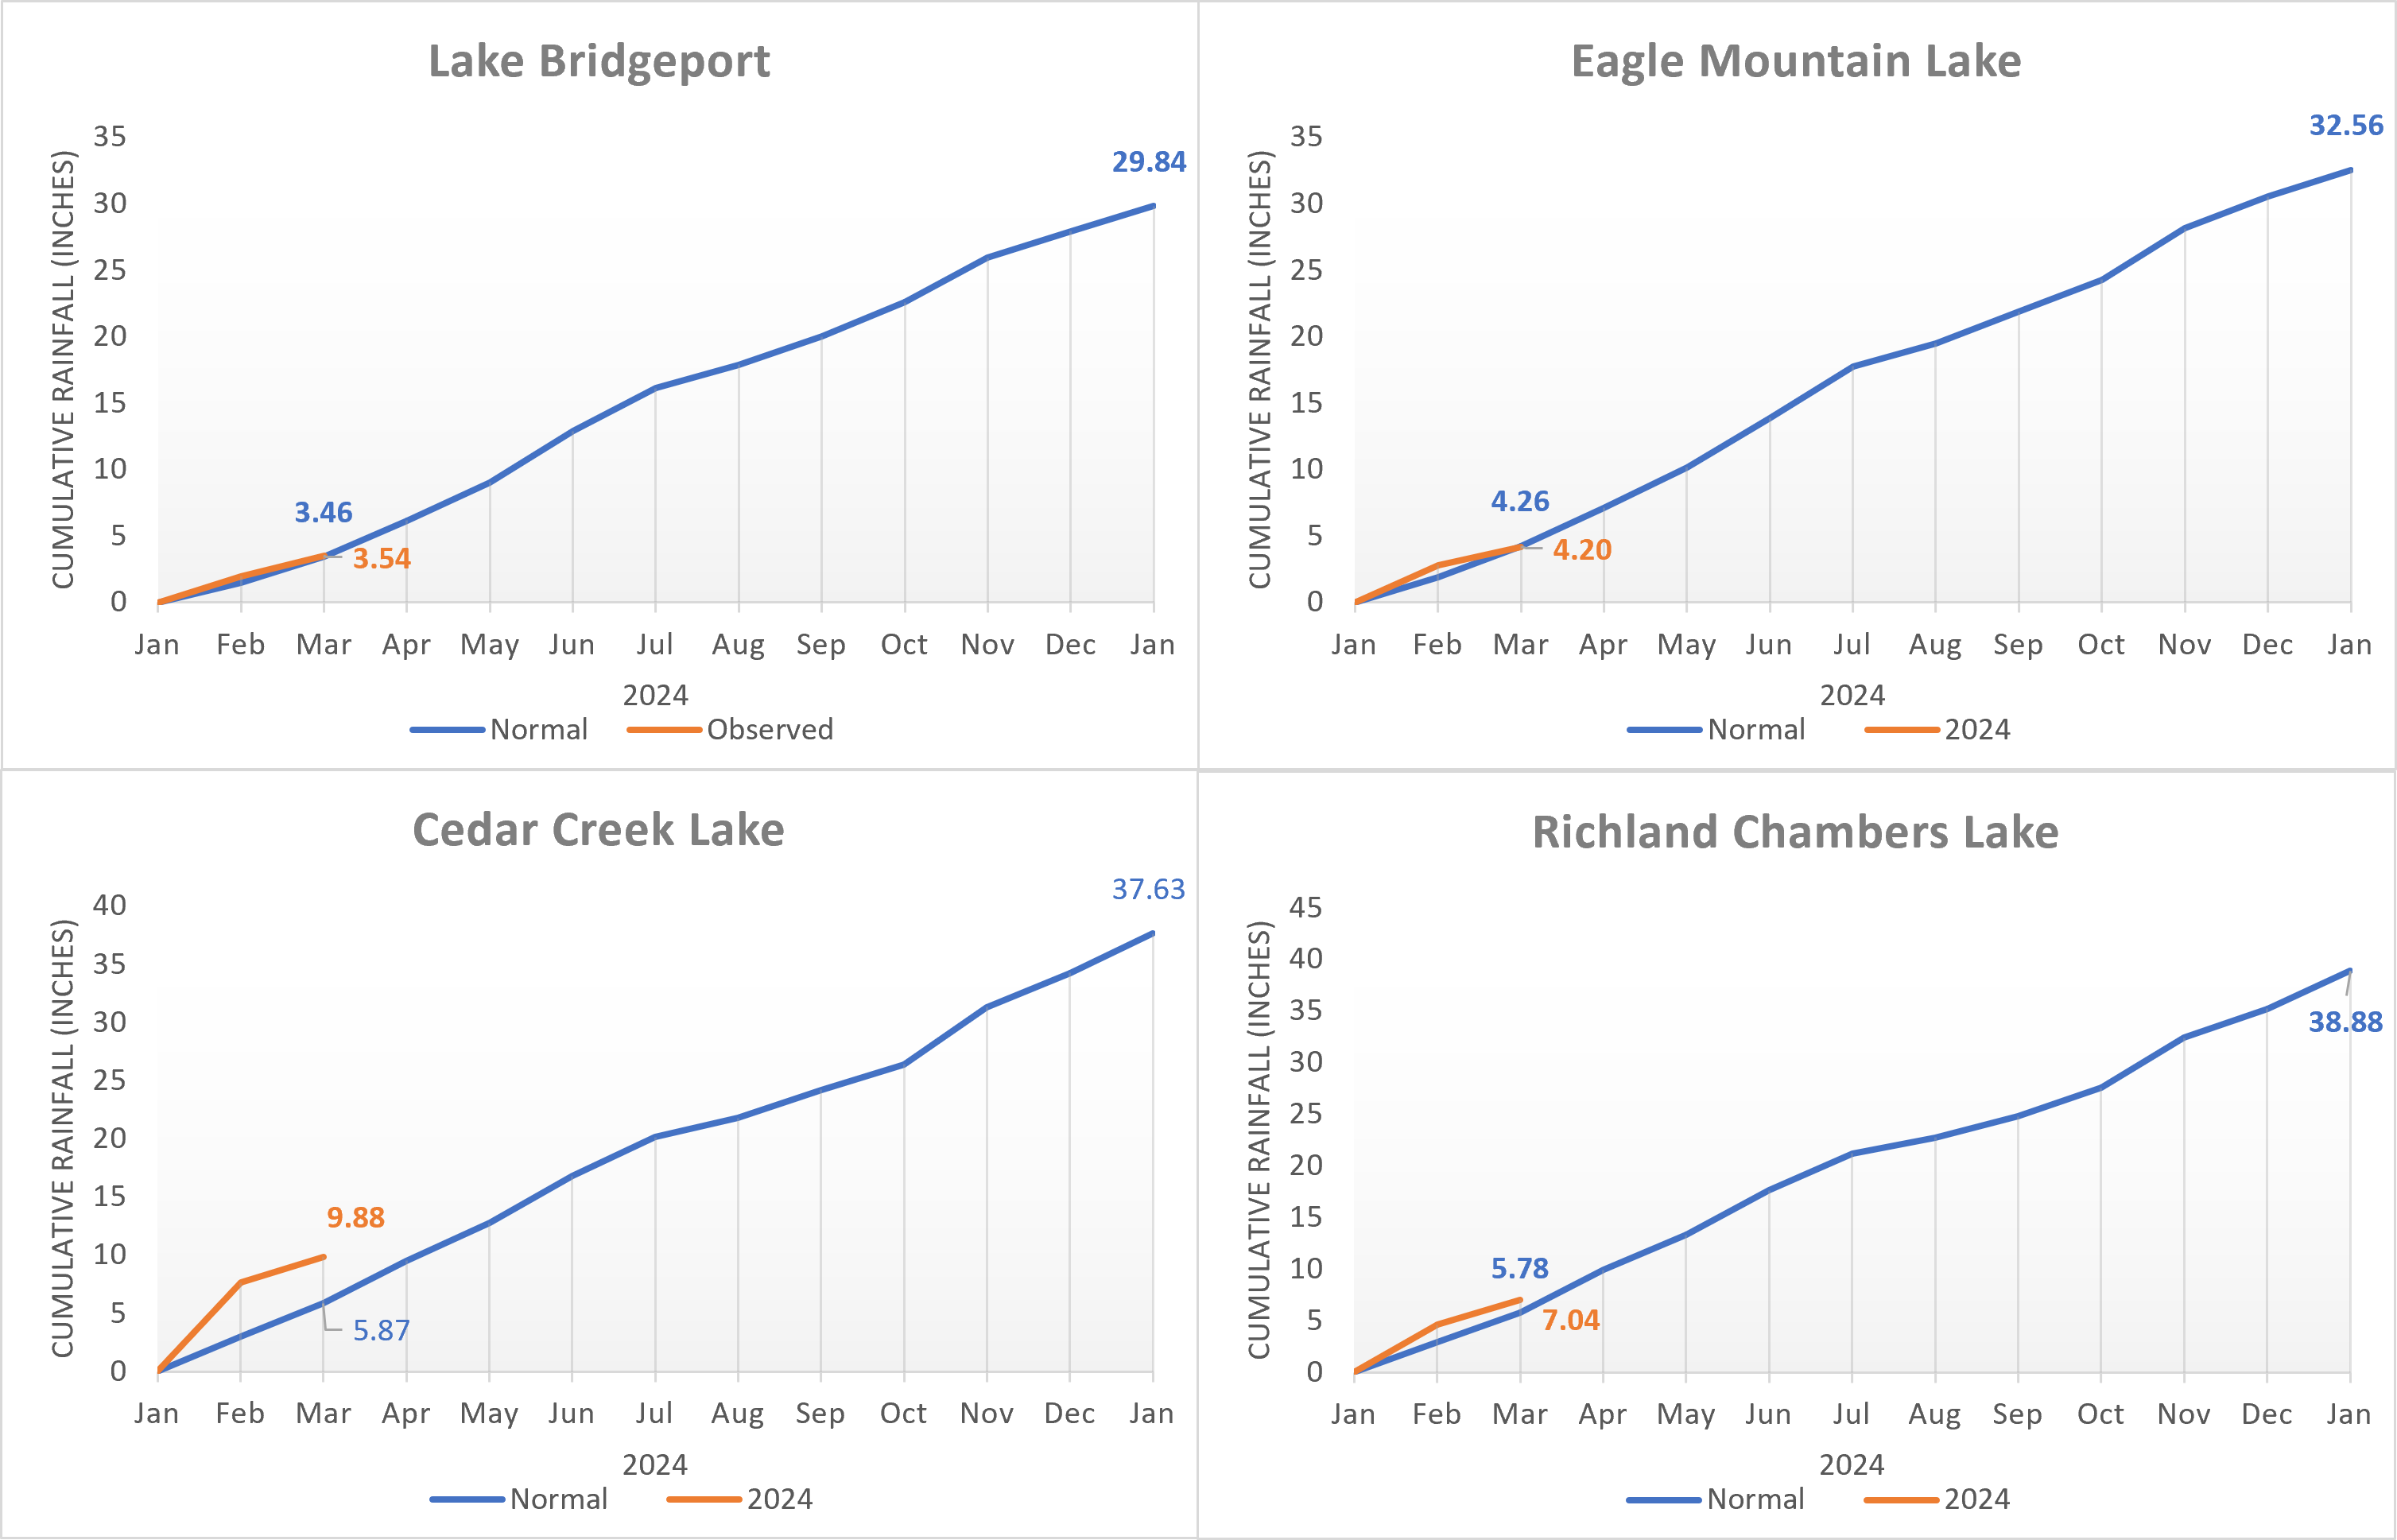
TRWD Lake Rainfall Totals though February 28, 2024
Despite a dry February, the rainfall North Texas received the last few months has helped the region see major improvements in drought intensity and only a few small areas of “Abnormally Dry” conditions remain.
Looking ahead…
Models are indicating a higher chance of rain in early March. The precipitation forecast in the spring 2024 outlook is less defined with North Texas sitting between an expected above normal probability of precipitation to the east and below normal probability of precipitation to the west. Right now, there is a 79% chance of a transition from El Niño to neutral (neither El Niño nor La Niña) this spring. Typically, El Niño brings above normal rainfall March through May, while neutral brings about 2.5” less precipitation, on average, than El Niño events for North Texas. We are on the edge of our seats waiting to see how this transition impacts the region.
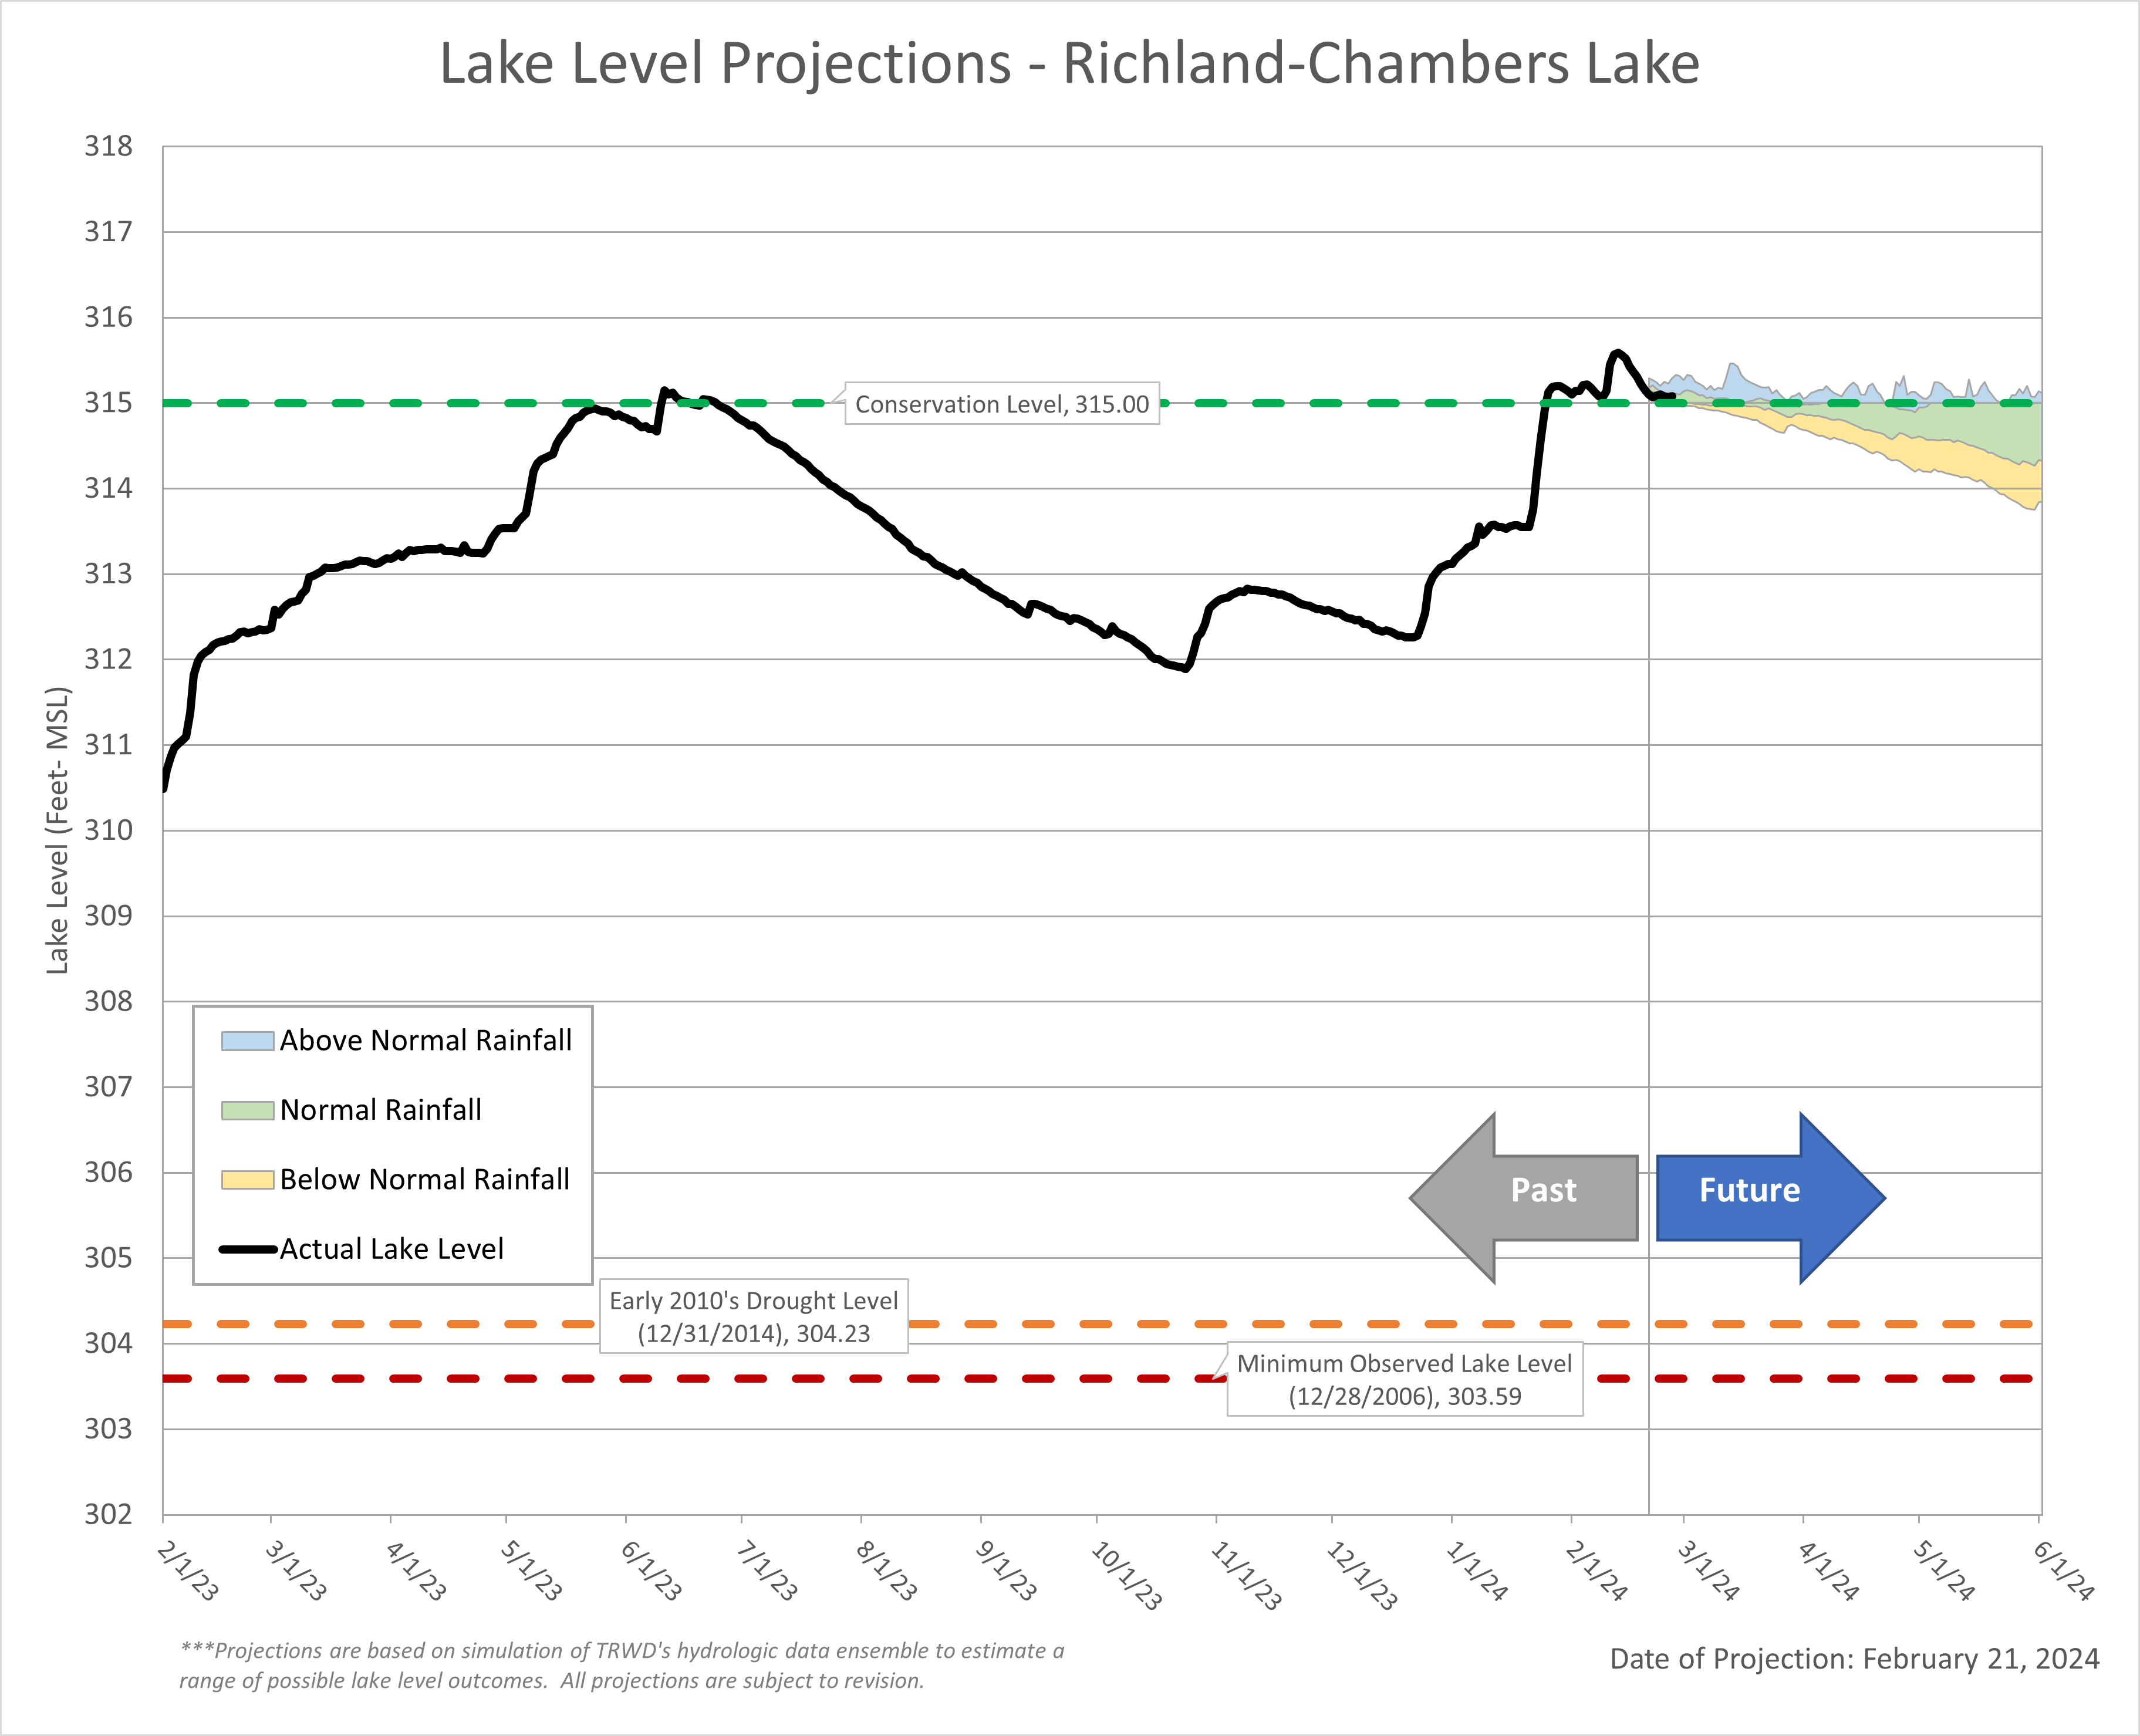
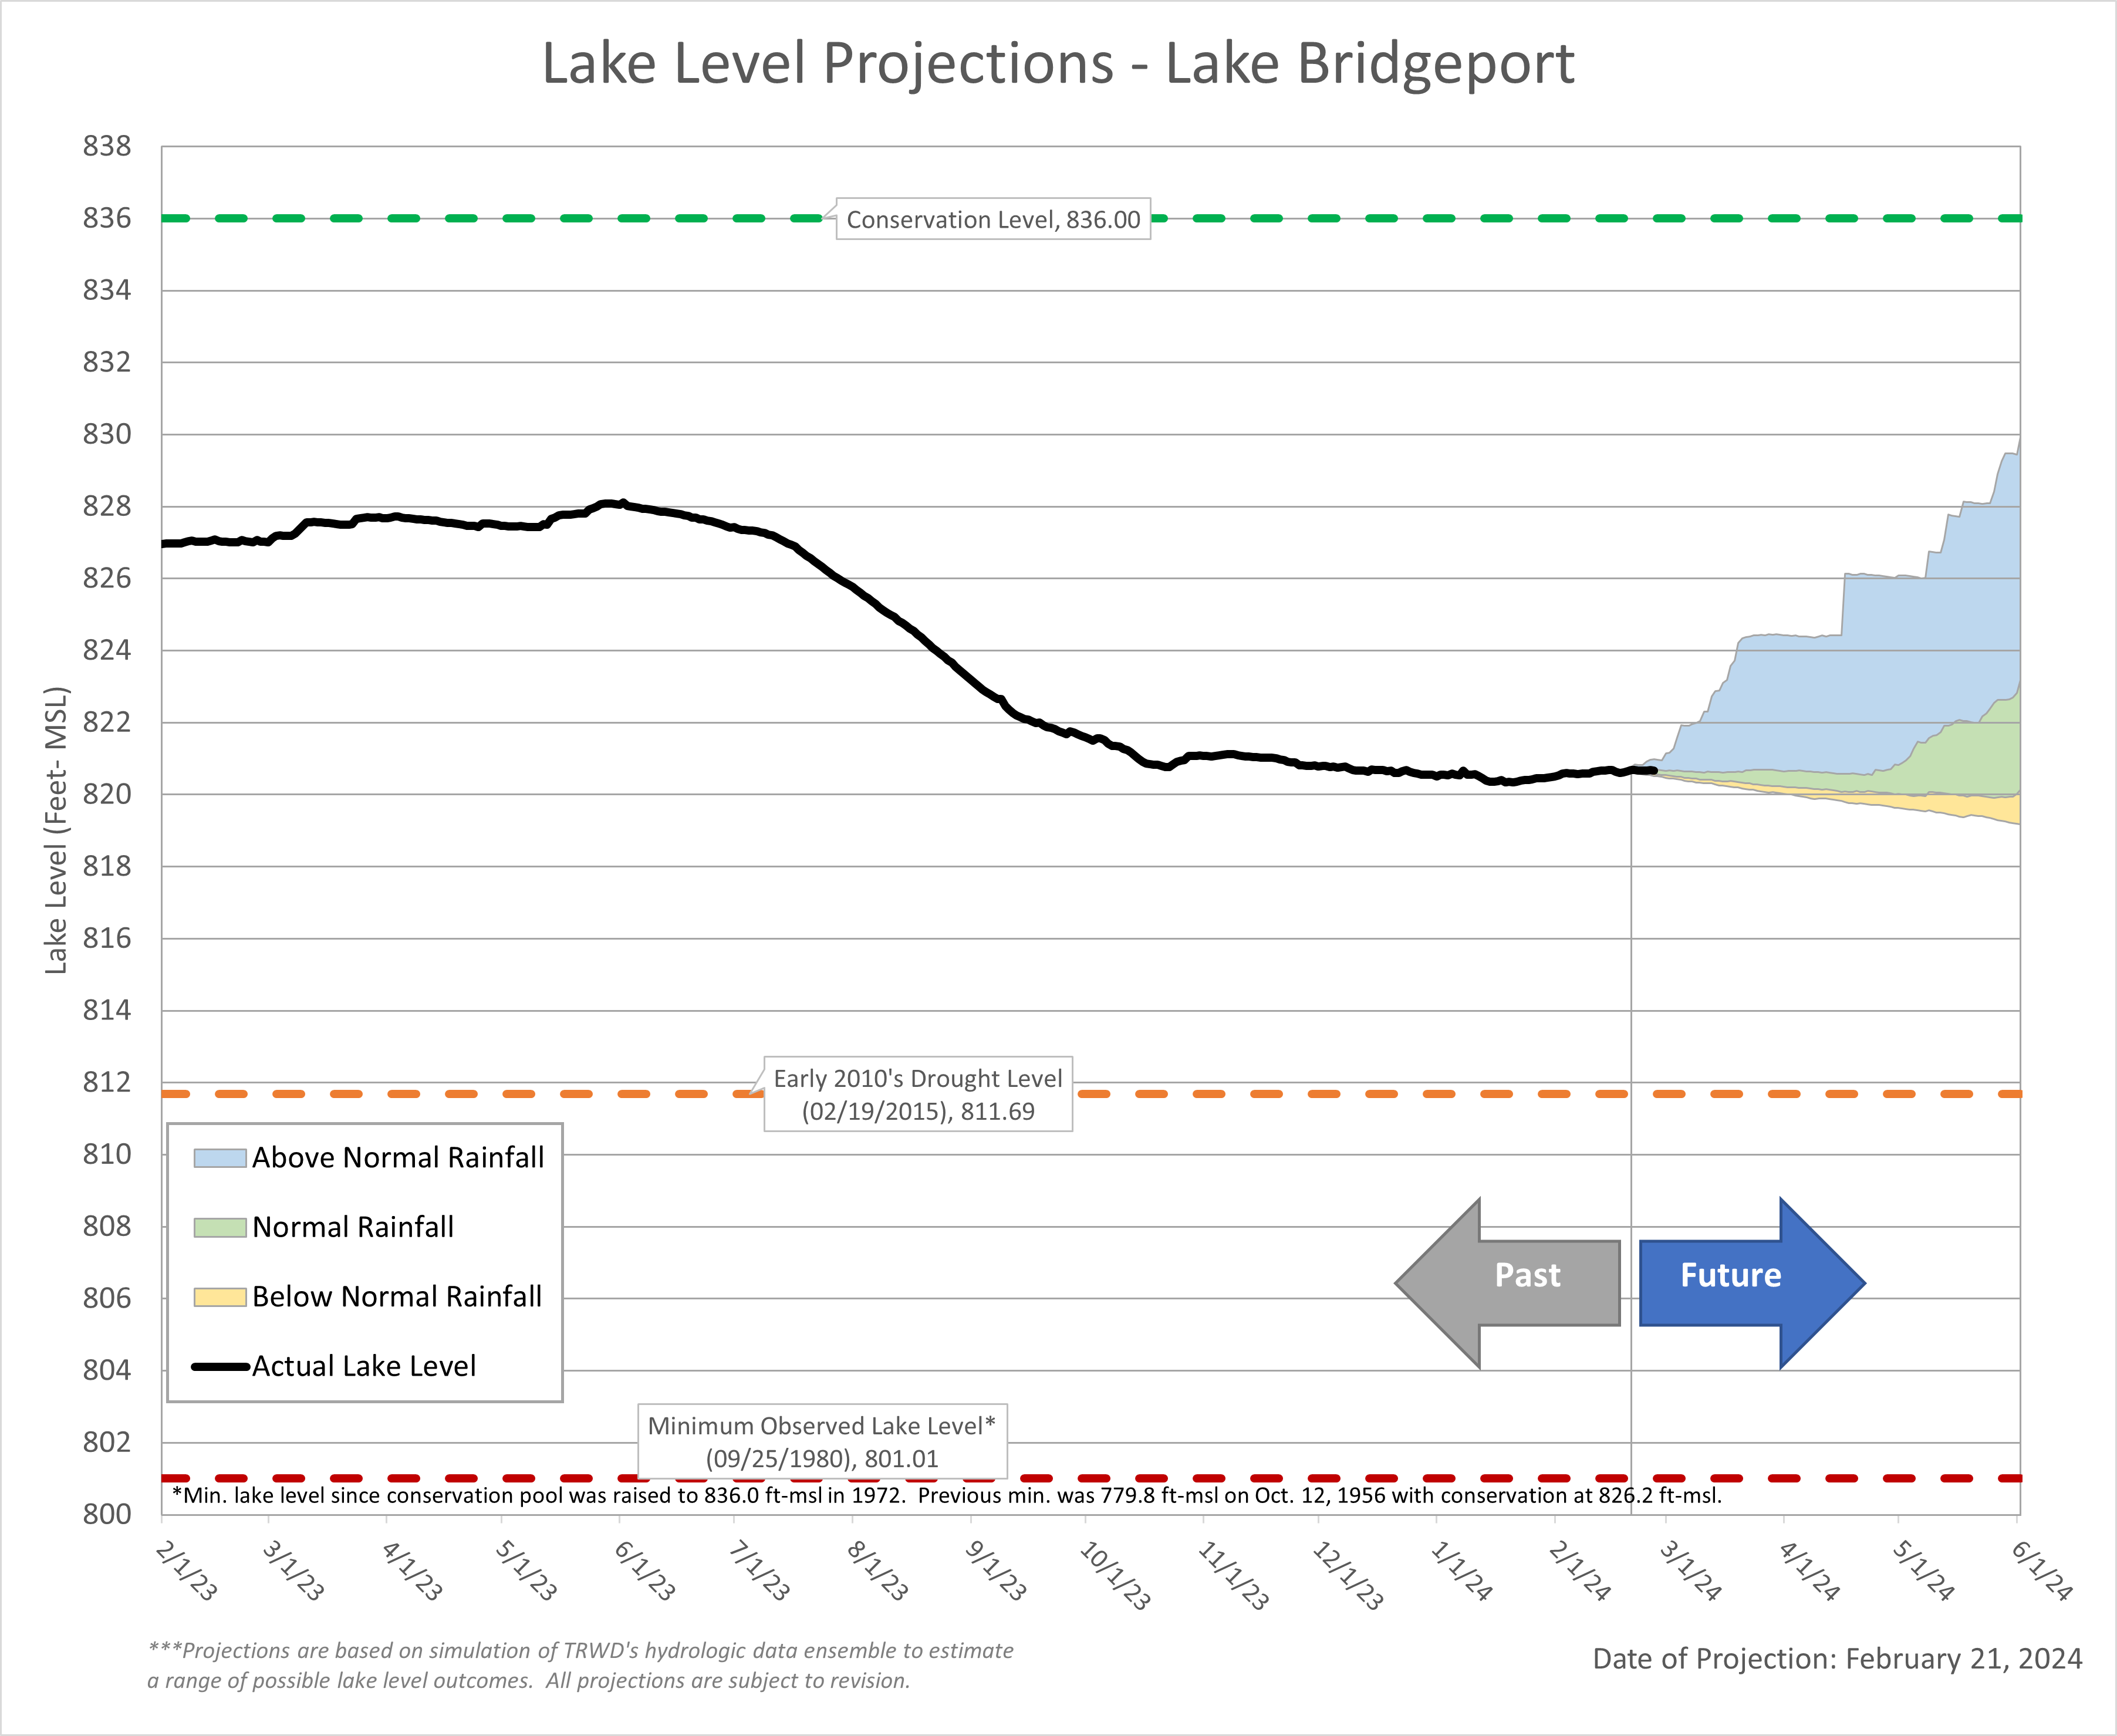
Projections
Lake Bridgeport
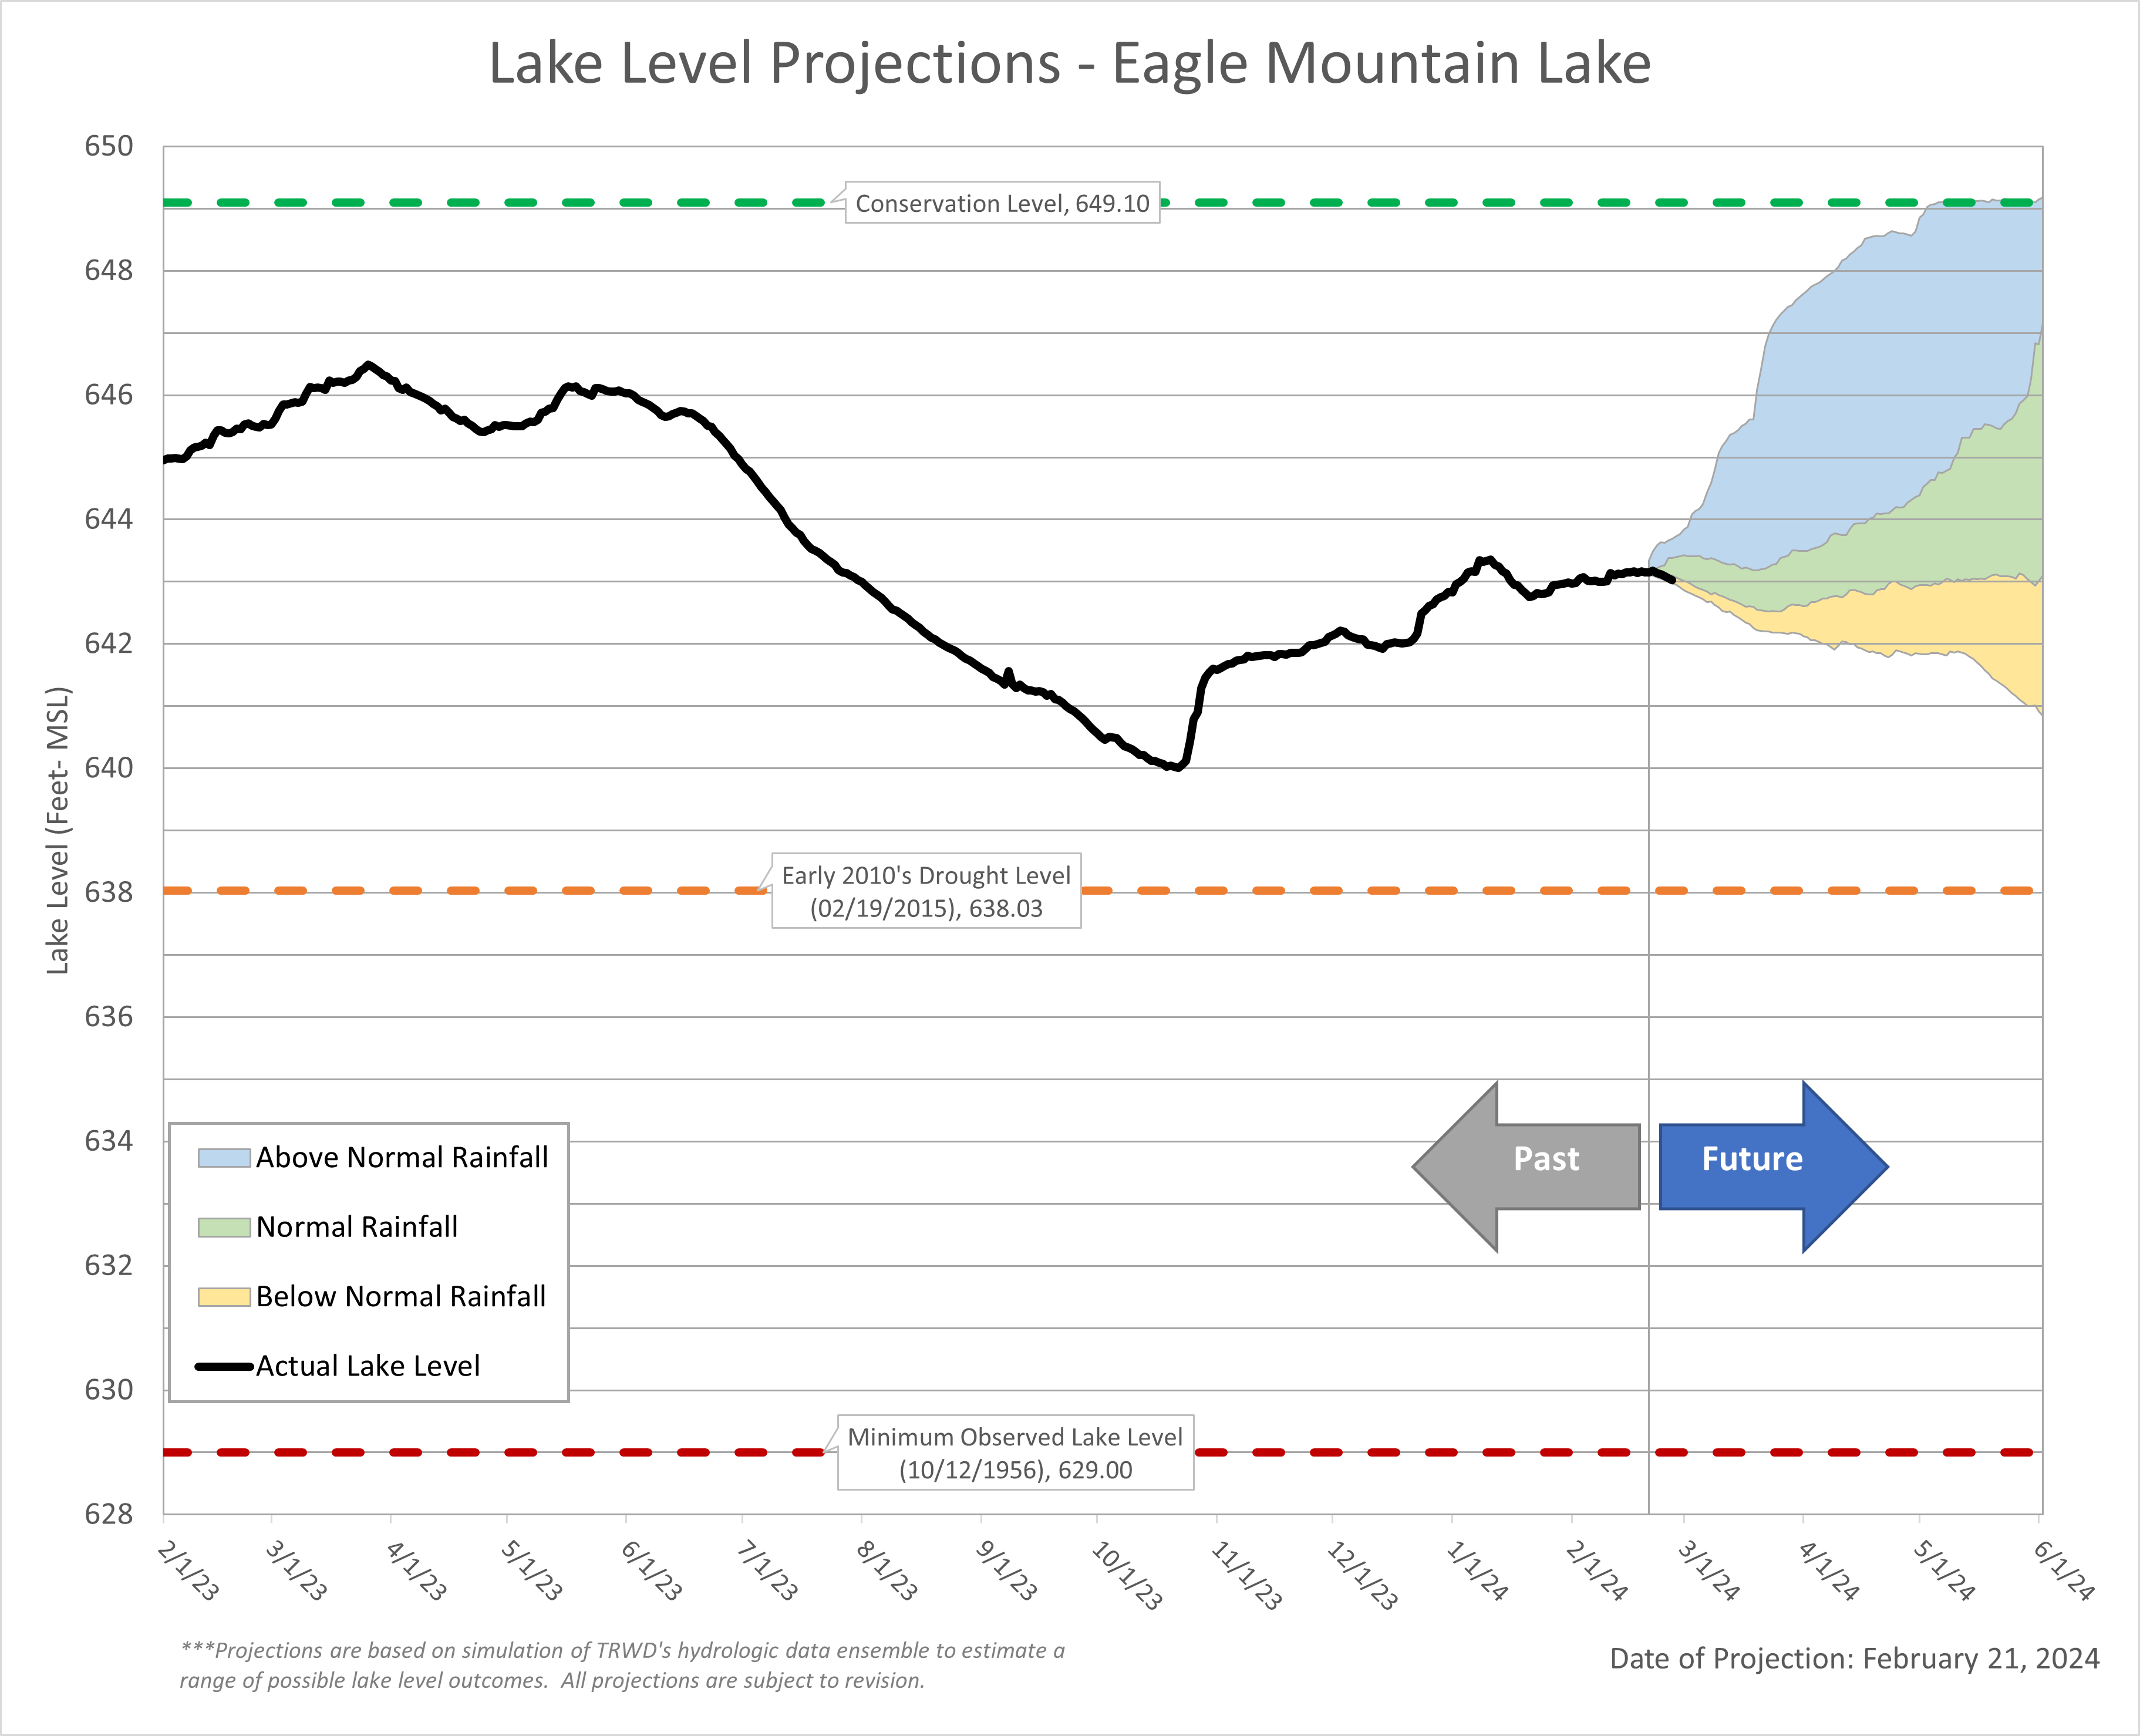
Eagle Mountain Lake
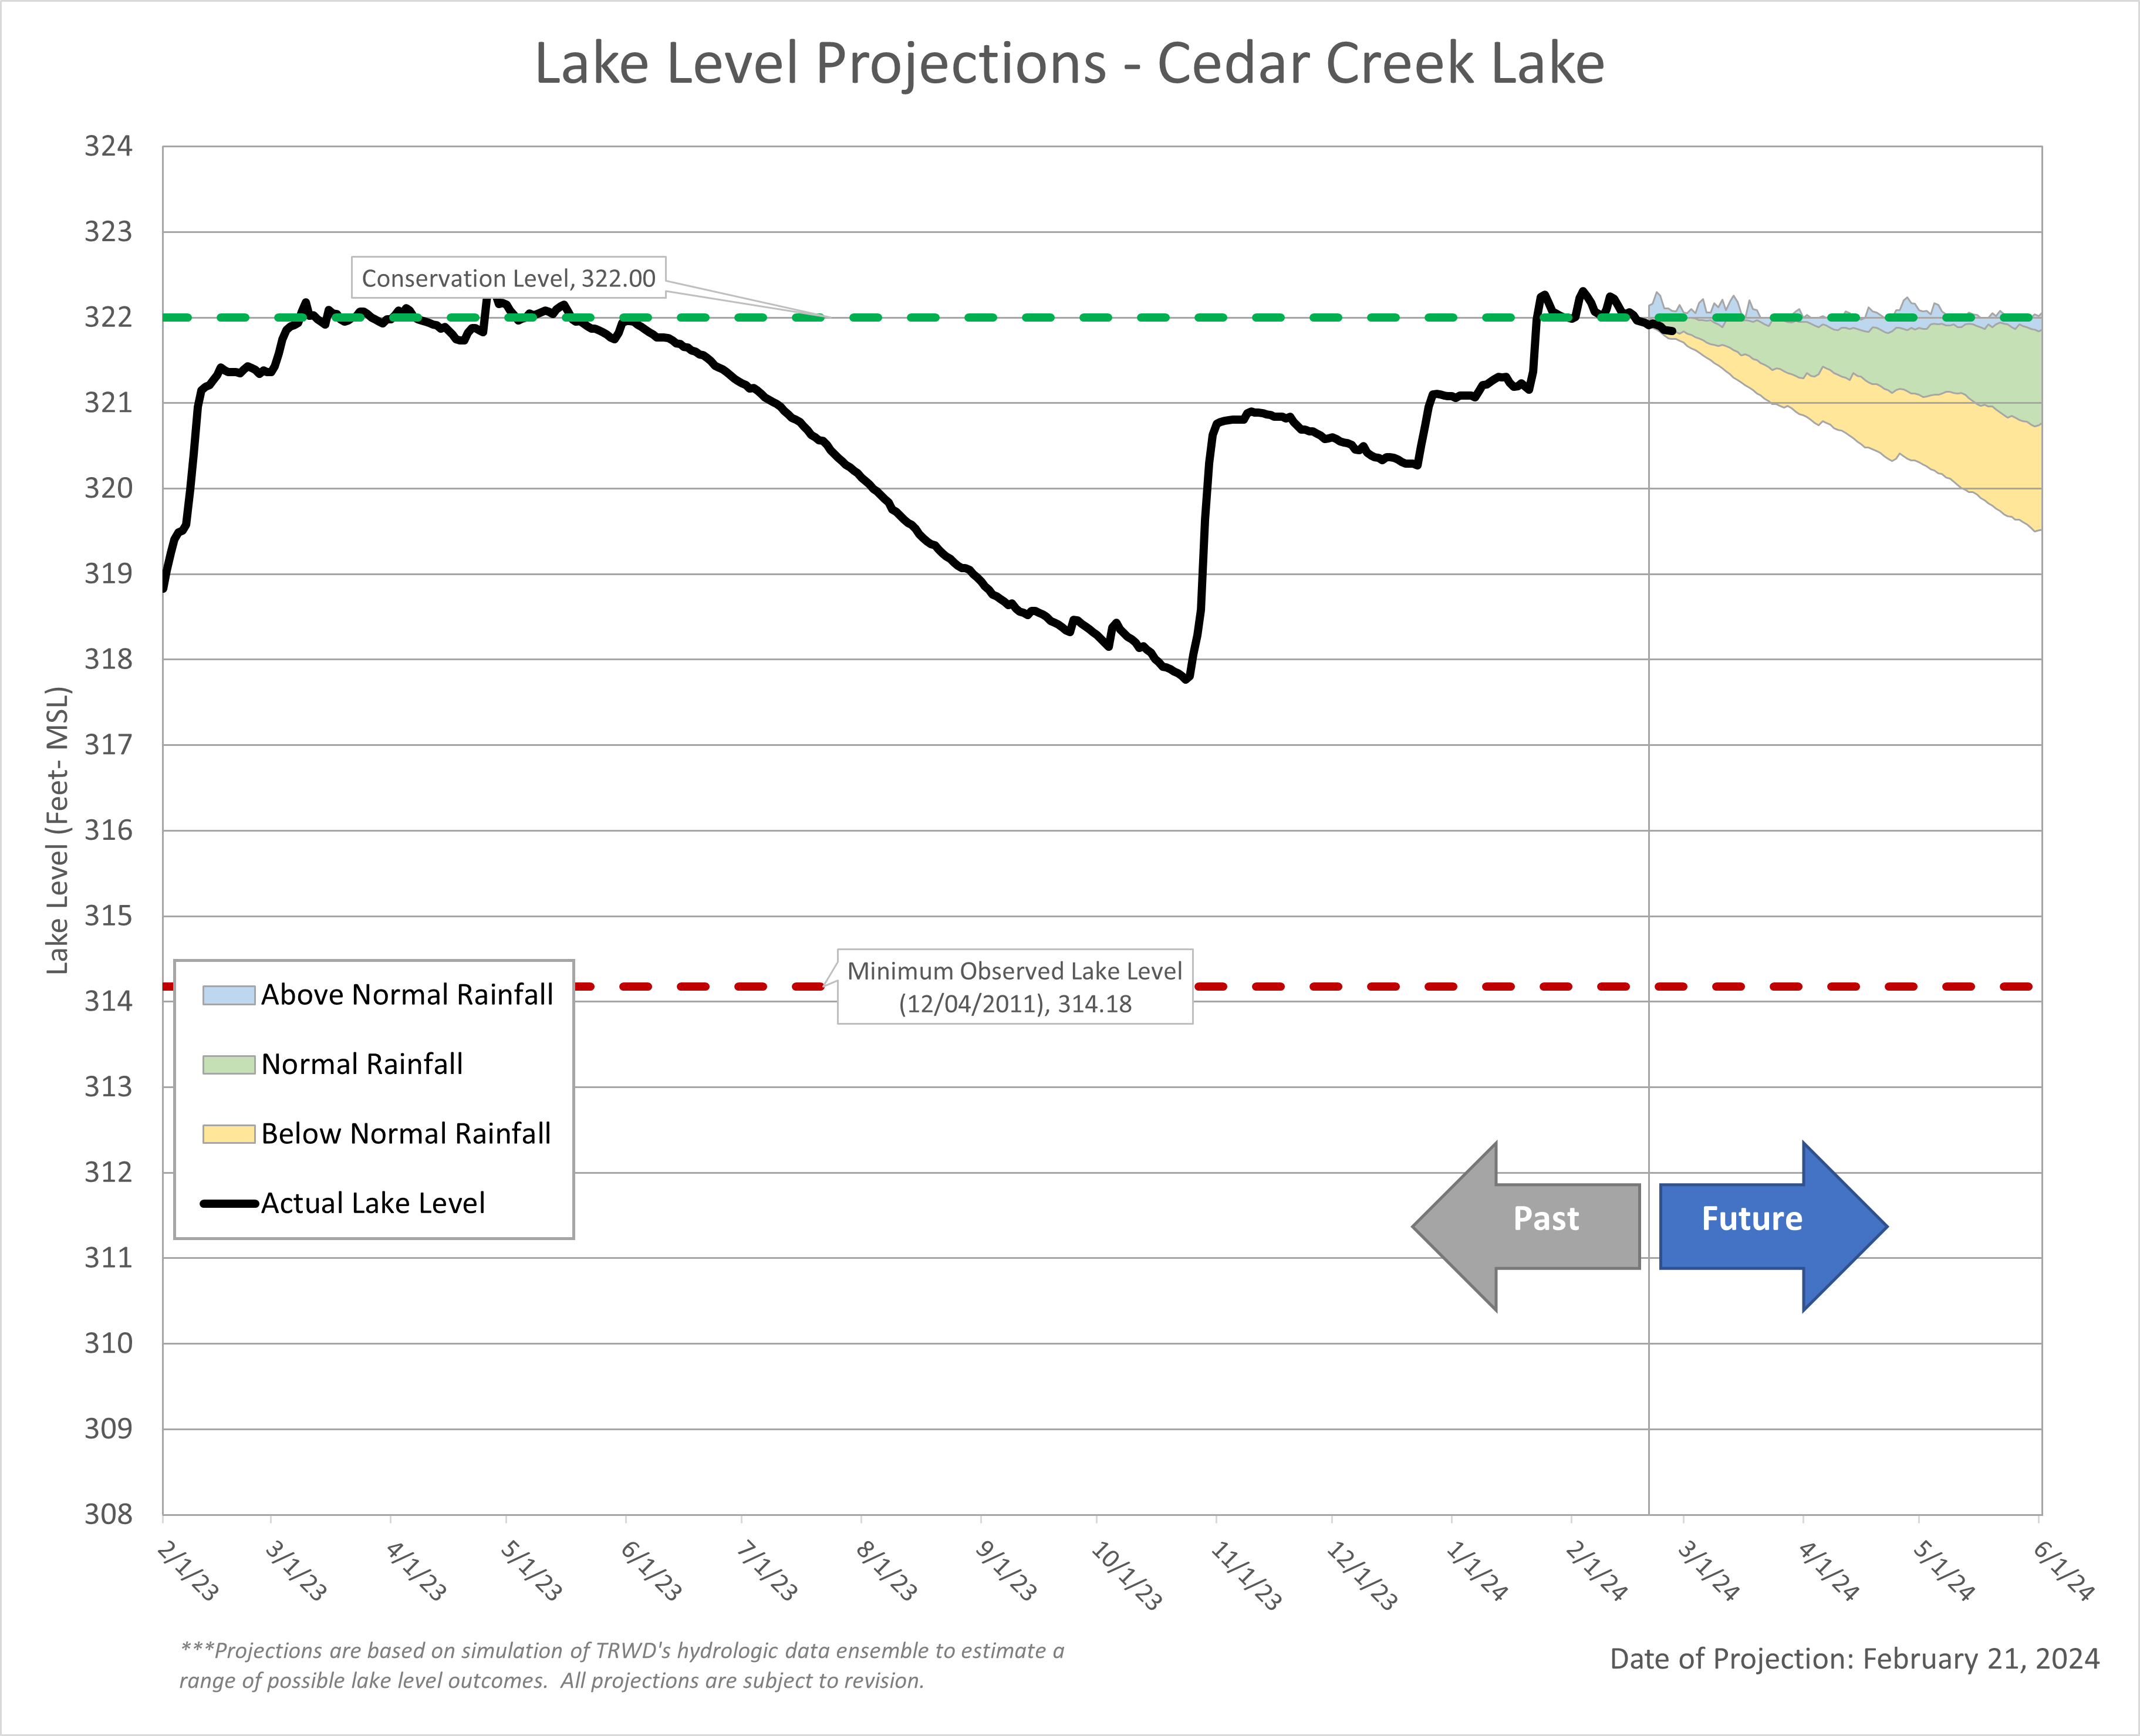
Cedar Creek Lake
Richland-Chambers Lake