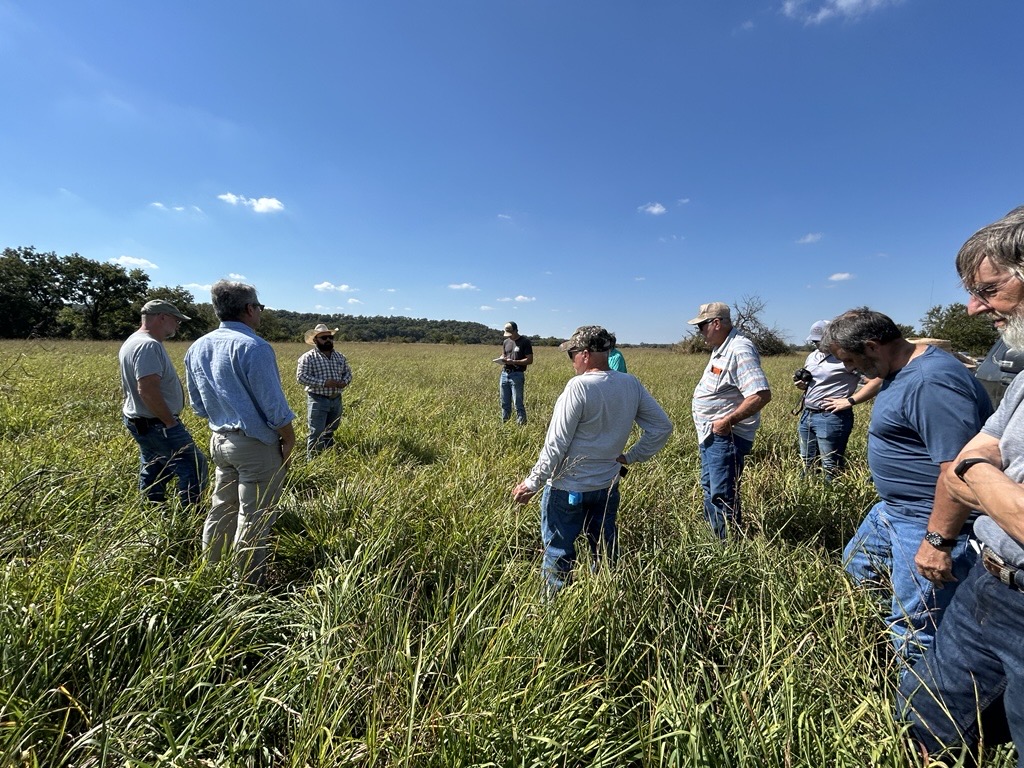
August brought exceptionally hot and dry conditions to North Texas. DFW Airport recorded only a trace of rainfall during the entire month, making August 2026 one of the driest Augusts on record. The month also ended with 46 consecutive days without measurable rainfall at DFW, tying for the 10th-longest such streak on record.
Dry conditions extended across TRWD’s watersheds, which received very little rainfall during August. While a few isolated storms brought rain to portions of the region, rainfall was generally localized and generated little inflow to TRWD reservoirs. With little rainfall to offset high summer evaporation and water demands, TRWD’s combined system storage declined from 88.7% on August 1 to 83.9% on August 31.
As we move into September, water demands should begin to ease from their typical August peak, while temperatures and evaporation rates generally decline with the changing season. Widespread rainfall across TRWD’s watersheds would help generate runoff and stabilize reservoir levels.
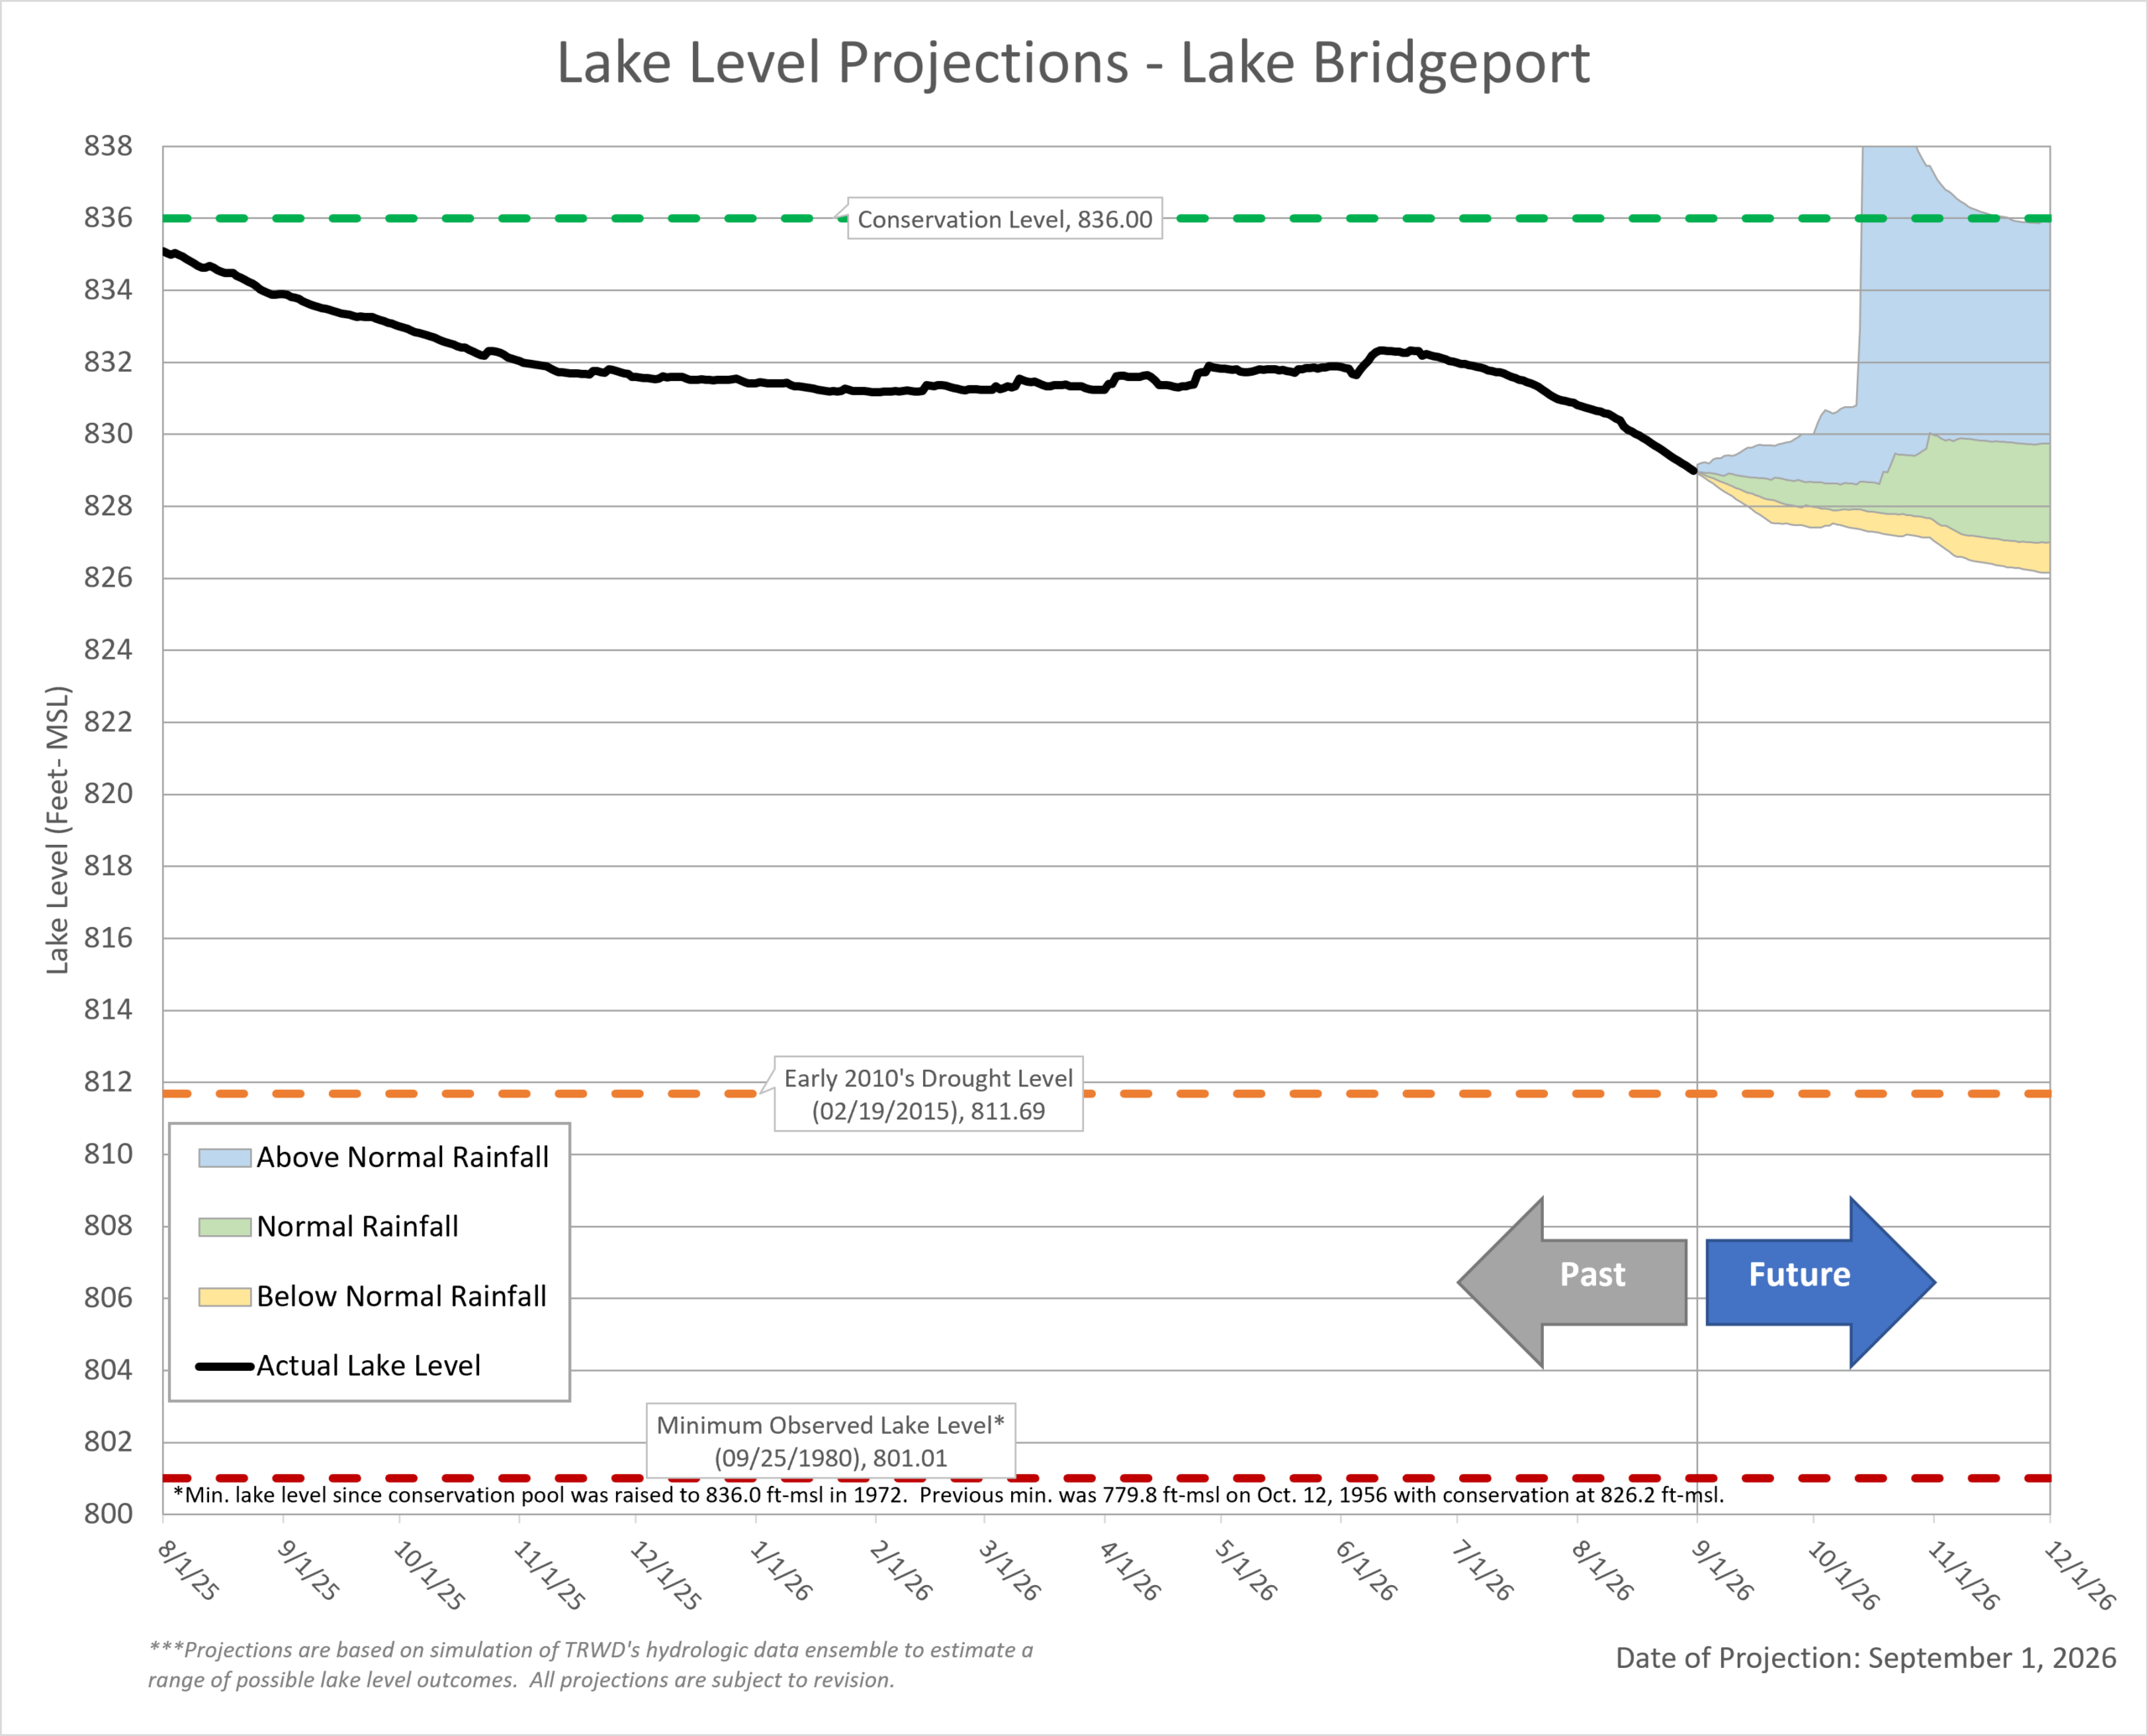
What to Expect: Based on current conditions, lake levels are expected to generally follow the “Normal Rainfall” or “Below Normal” trends represented by the green and yellow shaded areas on the Lake Level Projection Plots. Actual conditions may vary throughout the month, but lake levels would likely only move above those projected trends if the watersheds receive above-average rainfall.
August Highlights:
- Temperature: August was hot across North Texas, with DFW reaching 109°F on August 23 and 24. The monthly average temperature was 91.3°F, 5.6°F above normal.
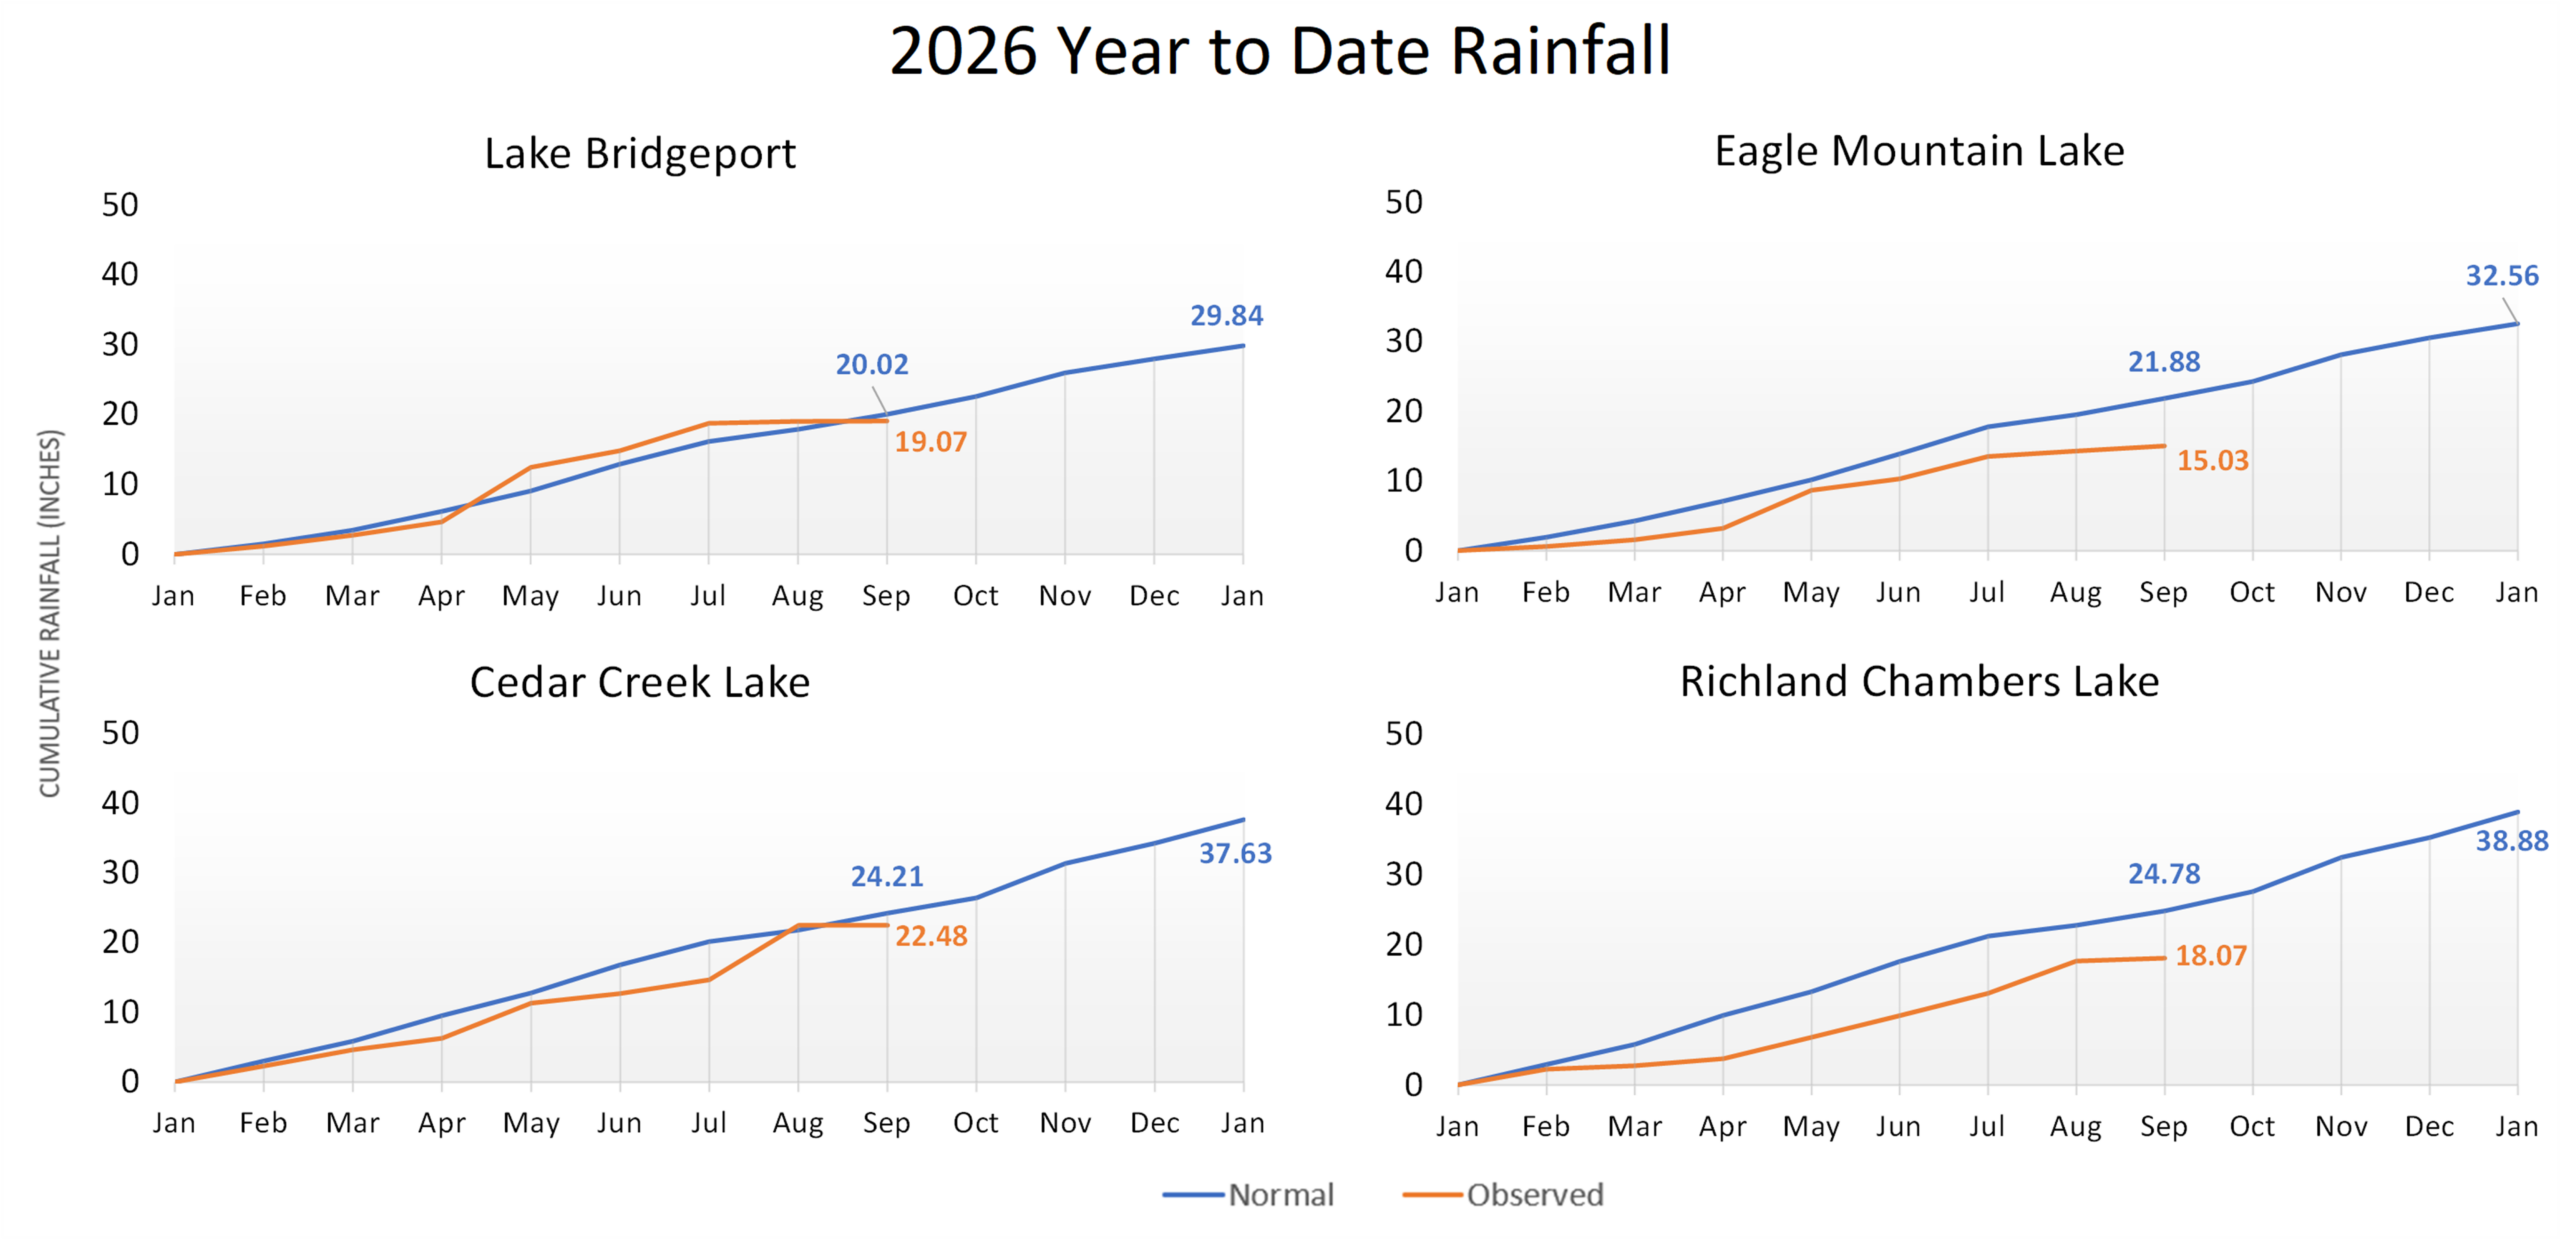
- Rainfall: DFW recorded only a trace of rainfall during August, compared with the normal August rainfall of 2.18 inches. TRWD’s watersheds were also exceptionally dry, generally receiving only a few tenths of an inch of rainfall during the month.
- Drought Conditions:
- Moderate Drought (D1) conditions expanded across North Texas during August, with Severe Drought (D2) developing in portions of the West Fork watershed.
- View the latest conditions on the NWS Drought Monitor.
Looking Ahead:
- ENSO Conditions: El Niño continues to strengthen. NOAA’s Climate Prediction Center indicates a greater than 90% chance of a very strong El Niño during fall and winter 2026–27.
- Rainfall: Equal chances of near-normal precipitation totals are expected for September. Longer-range outlooks also indicate equal chances of near-normal precipitation through the fall.
- Temperatures: Above-normal temperatures are favored across Texas for September. Longer-range outlooks also favor above-normal temperatures across much of the central United States, including North Texas, through the fall.
- Looking Further: A strengthening El Niño remains an important factor heading into fall and winter. El Niño can favor wetter conditions across Texas during the cool season, but it does not guarantee above-normal rainfall at any particular location. Reservoir projections will continue to be updated as rainfall patterns and seasonal conditions develop.
*Note: ENSO, or the El Niño-Southern Oscillation, is a recurring climate pattern that influences global weather. It has two main phases: El Niño, which often brings wetter conditions, and La Niña, which typically leads to drier and warmer weather in Texas, especially during fall and winter. This shift is important for water resource planning, as it can affect rainfall and reservoir levels.
Stay Informed by Checking Out the Following:
- TRWD’s quarterly watershed protection newsletter, The Tributary.
- The latest Lake Level Projections (see below).
- Links to historical lake level plots.
- Past projections compared to actual outcomes.
Thank you for following the Lake Level Blog. Check back next month for more updates!
TRWD Watershed Rainfall
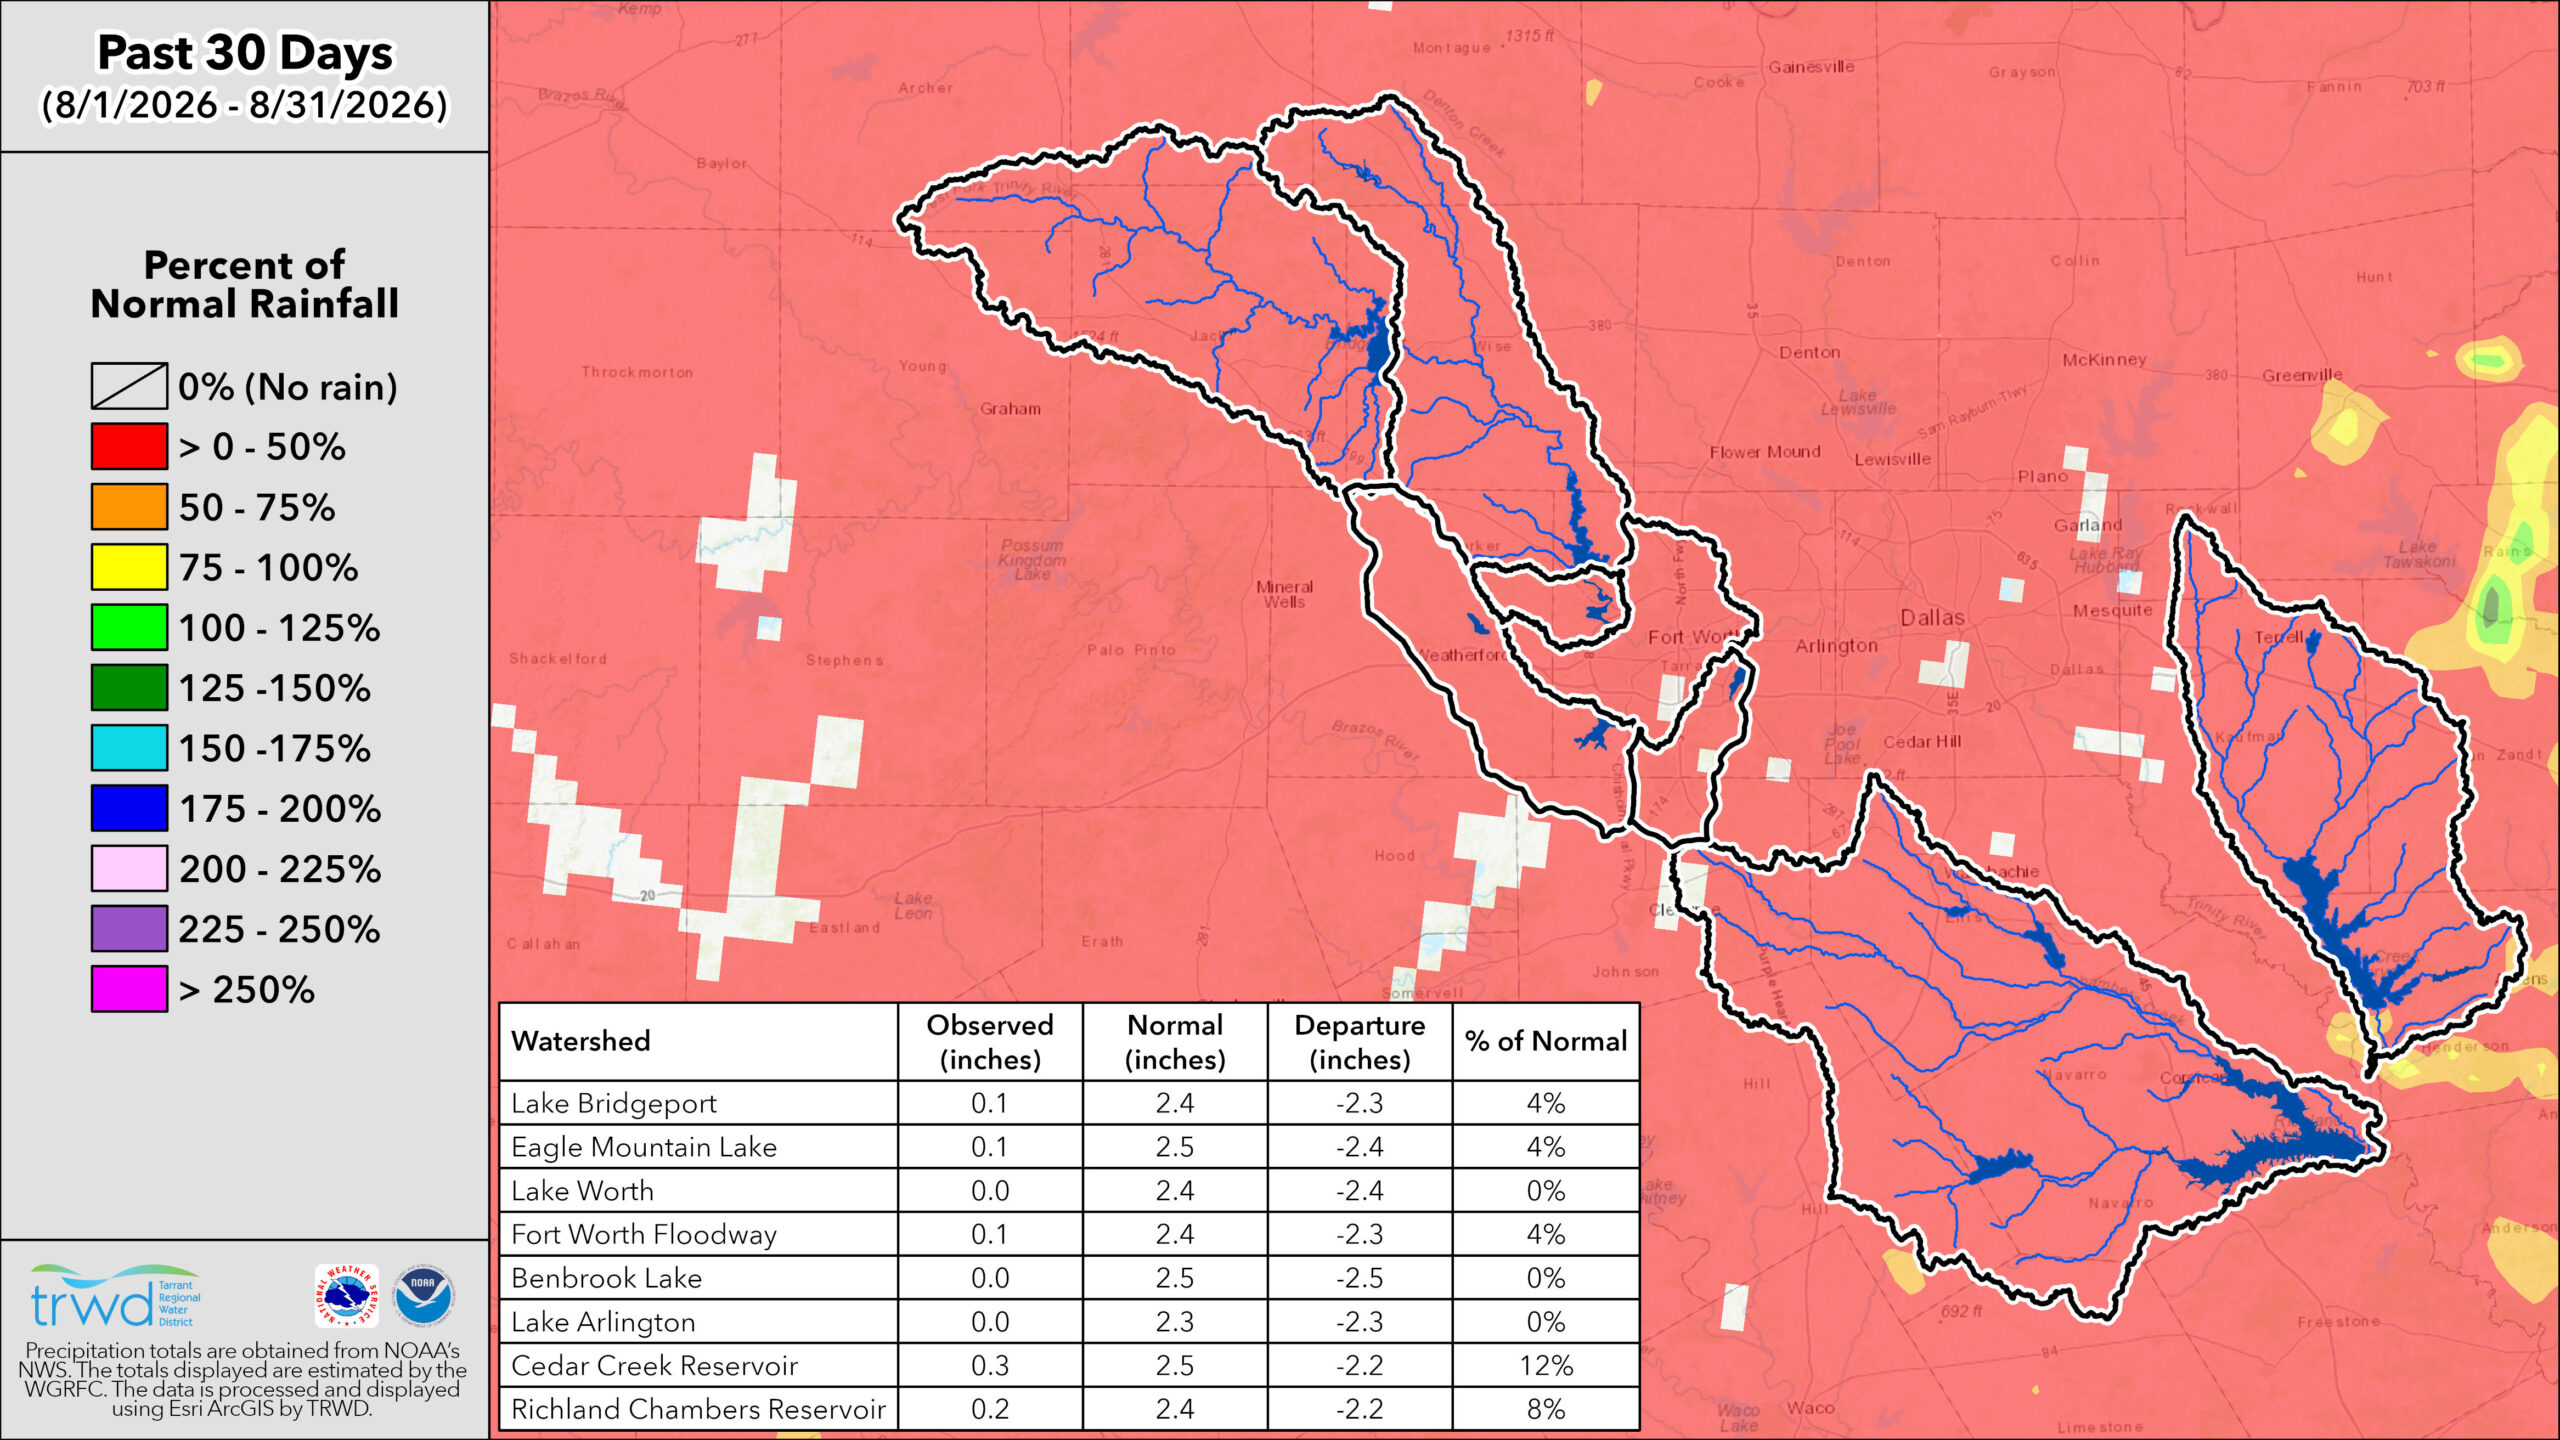
TRWD Lake Rainfall Totals through September 1, 2026
Lake Level Projections
Note: Lake level projections are based on expected climate conditions, water use demands, and planned operations, including releases and pumping. Actual lake levels may vary based on observed weather, actual water use, and operational responses to changing conditions.
 Last Month’s Projection | Historical Lake Levels
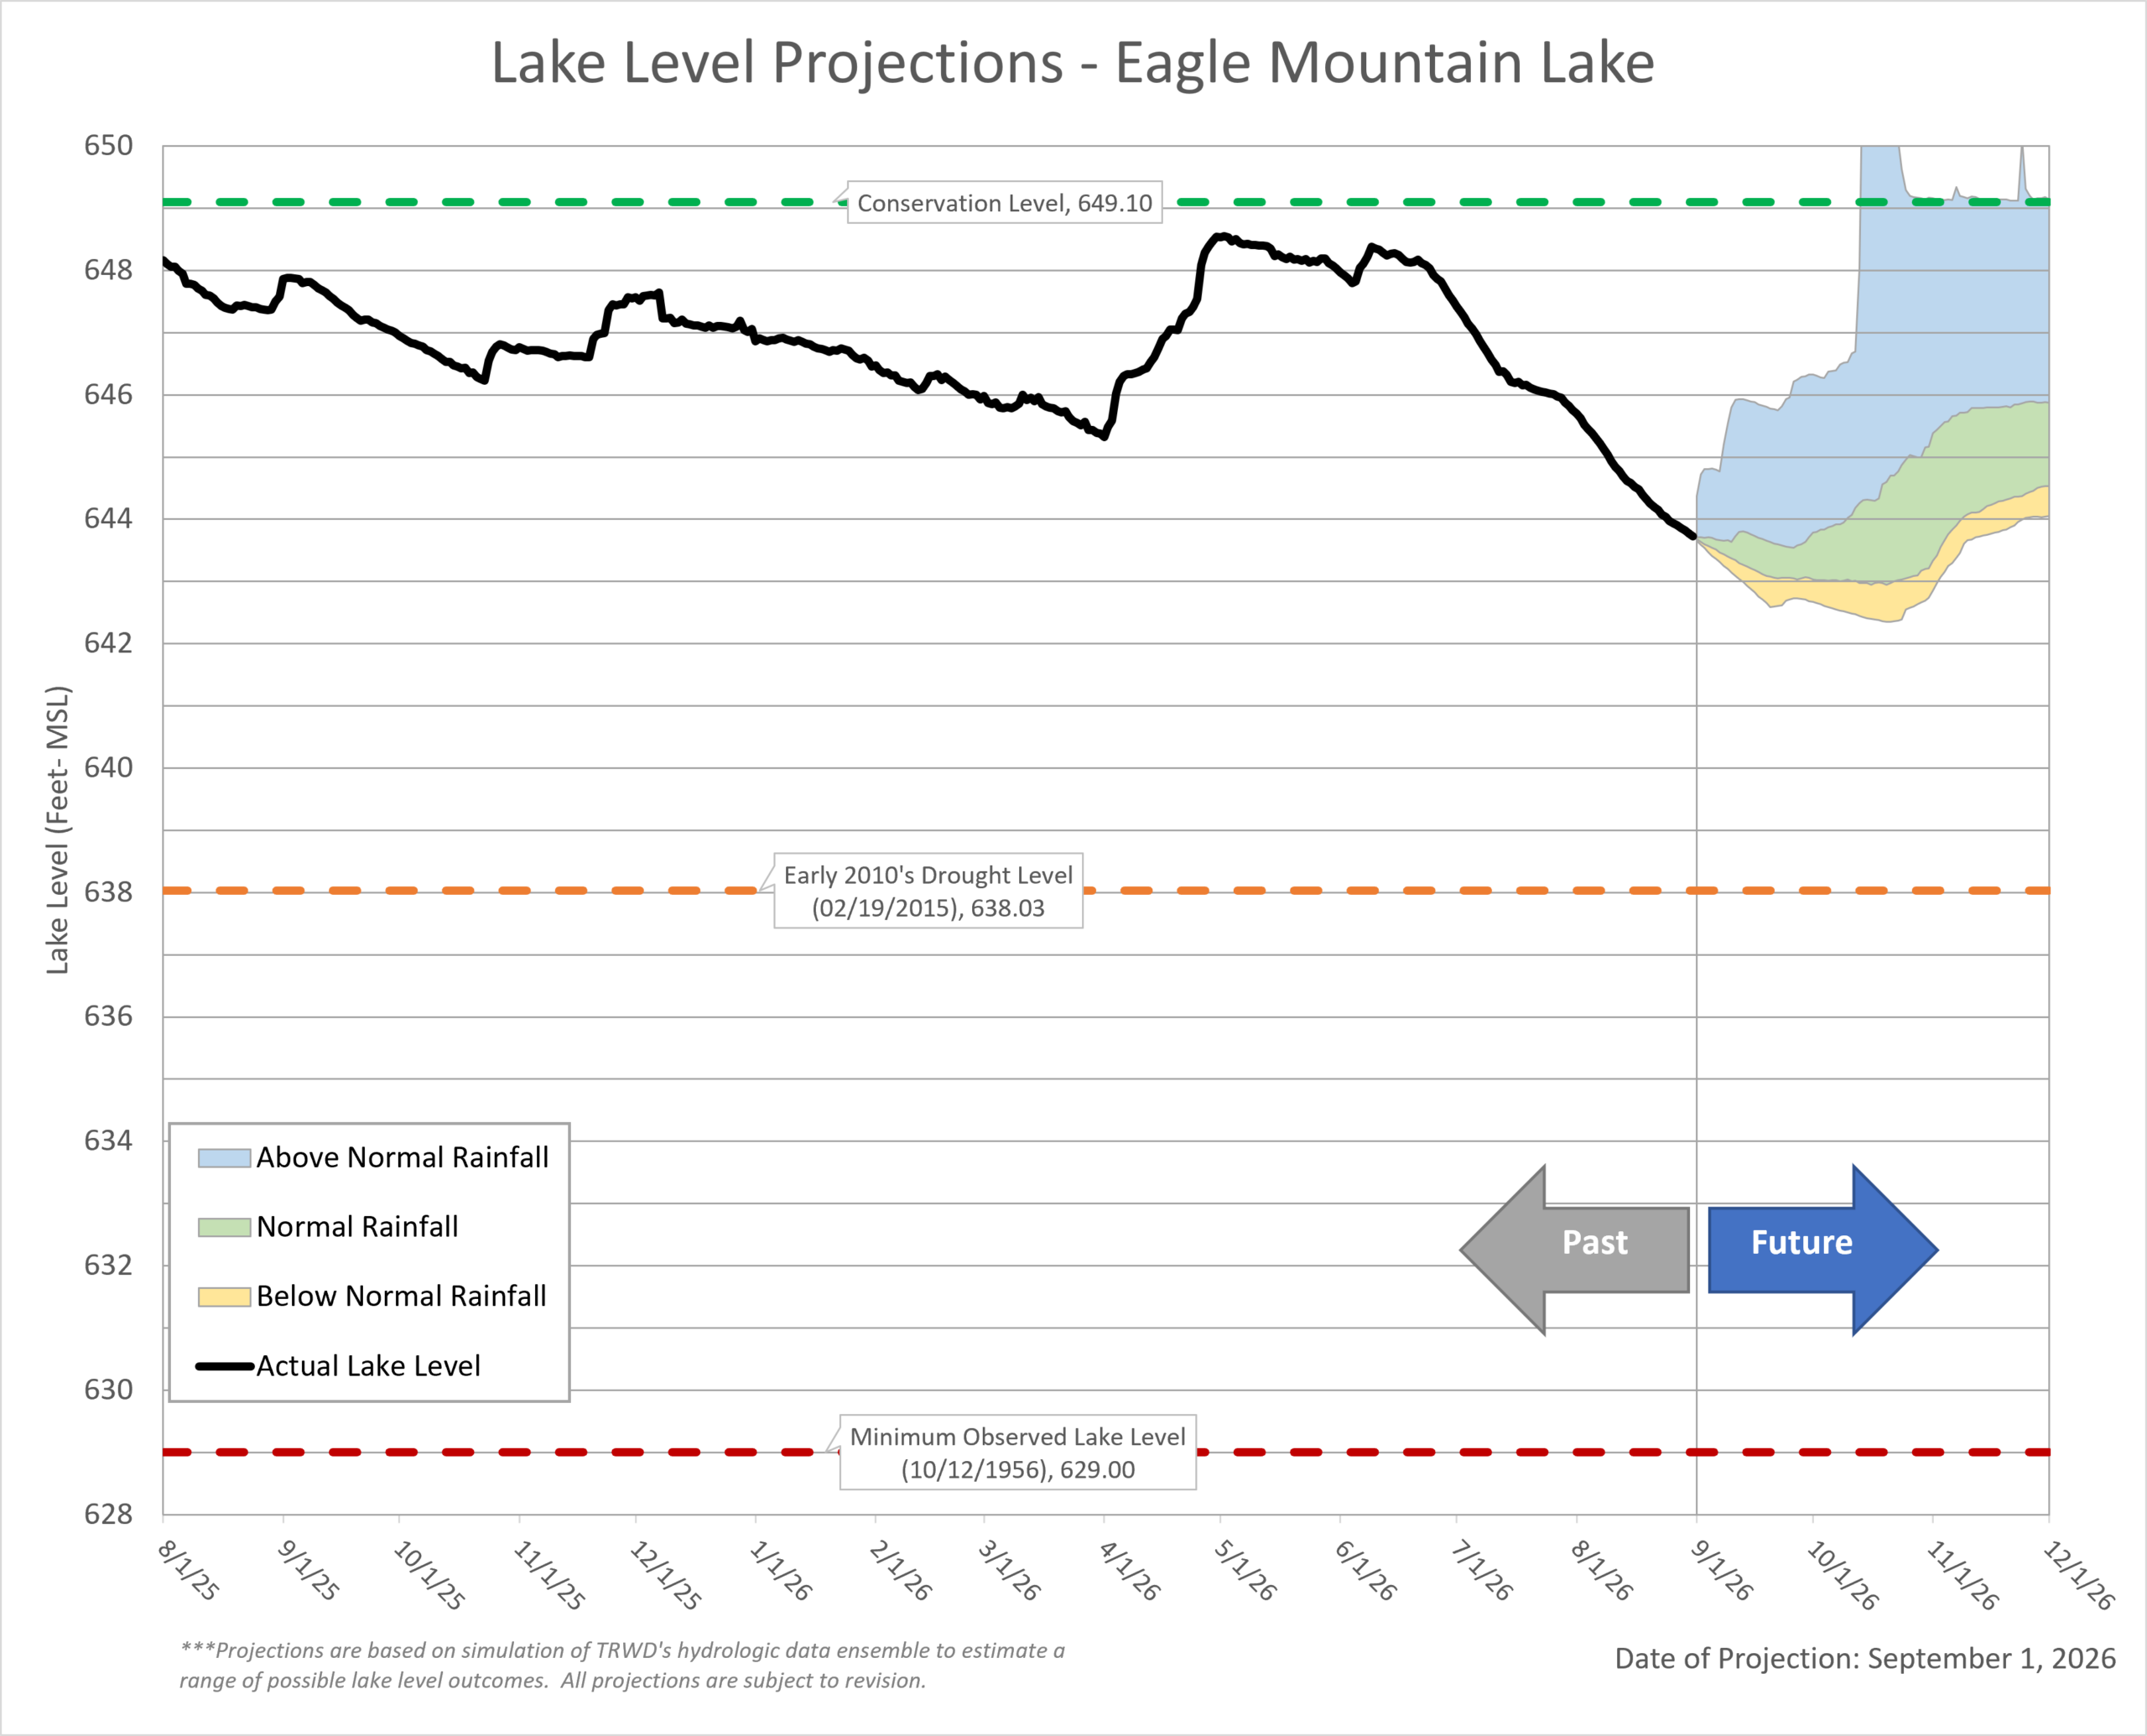 Last Month’s Projections | Historical Lake Levels
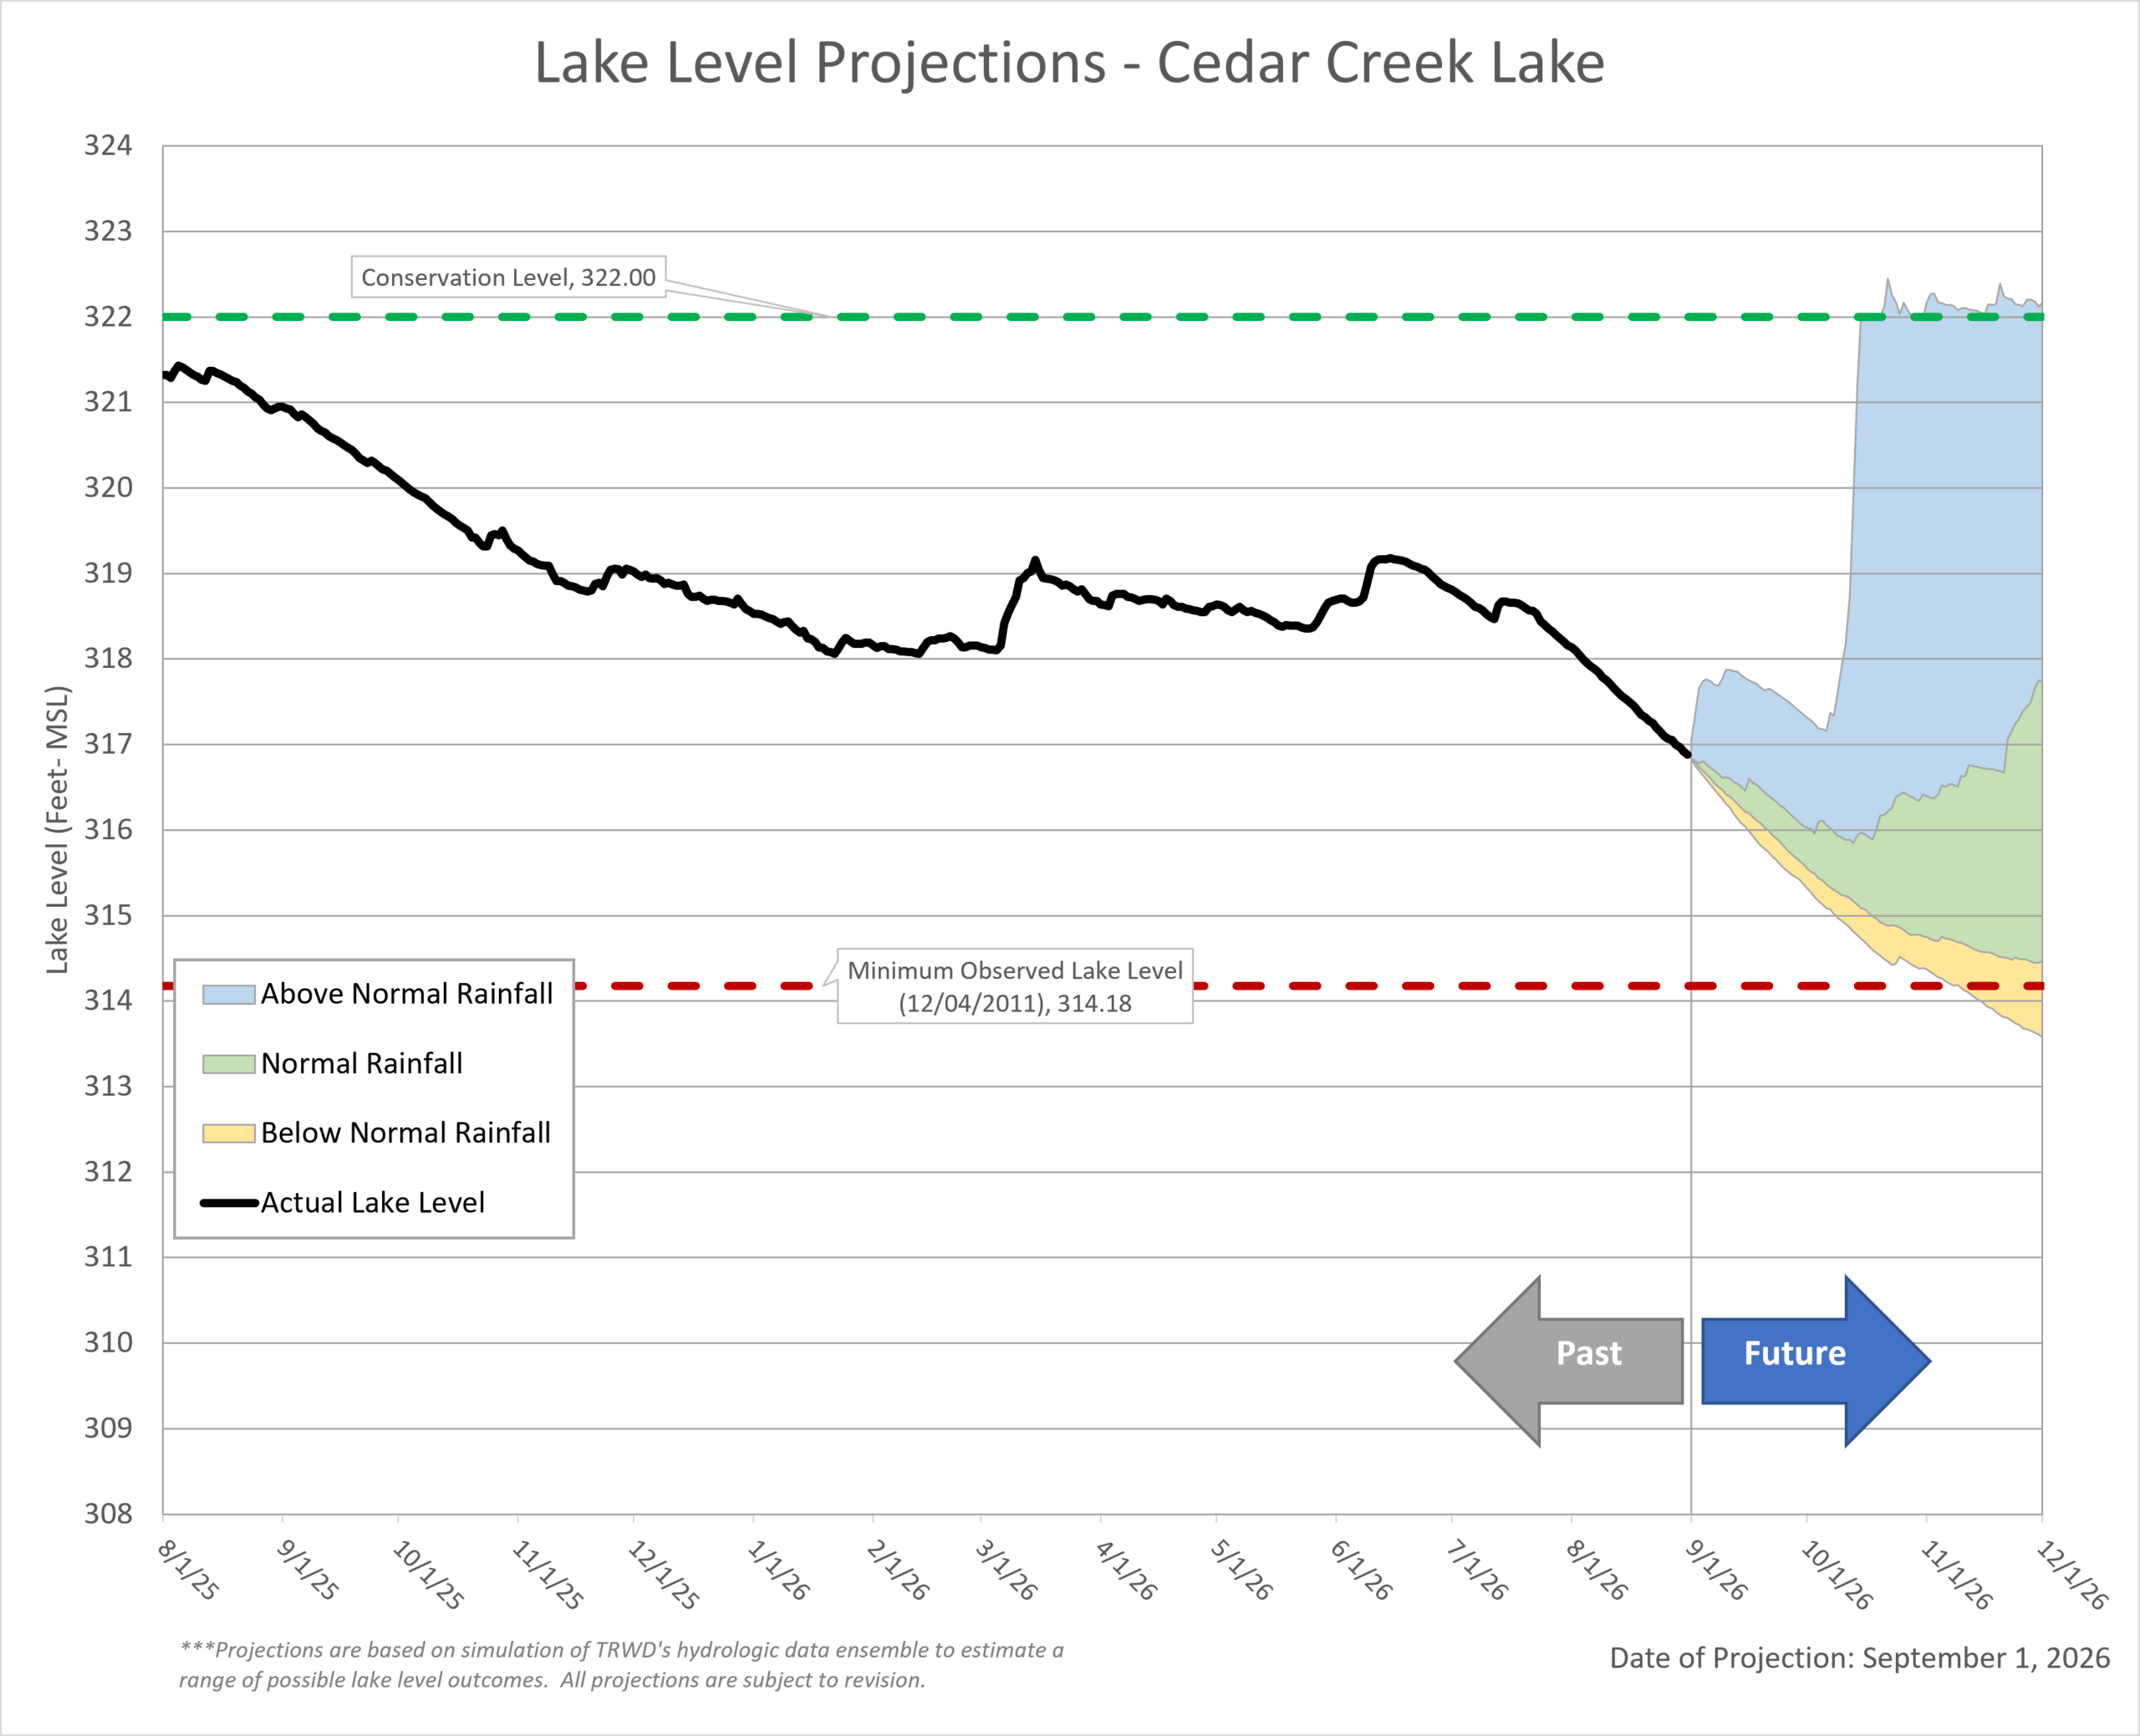 Last Month’s Projection | Historical Lake Levels
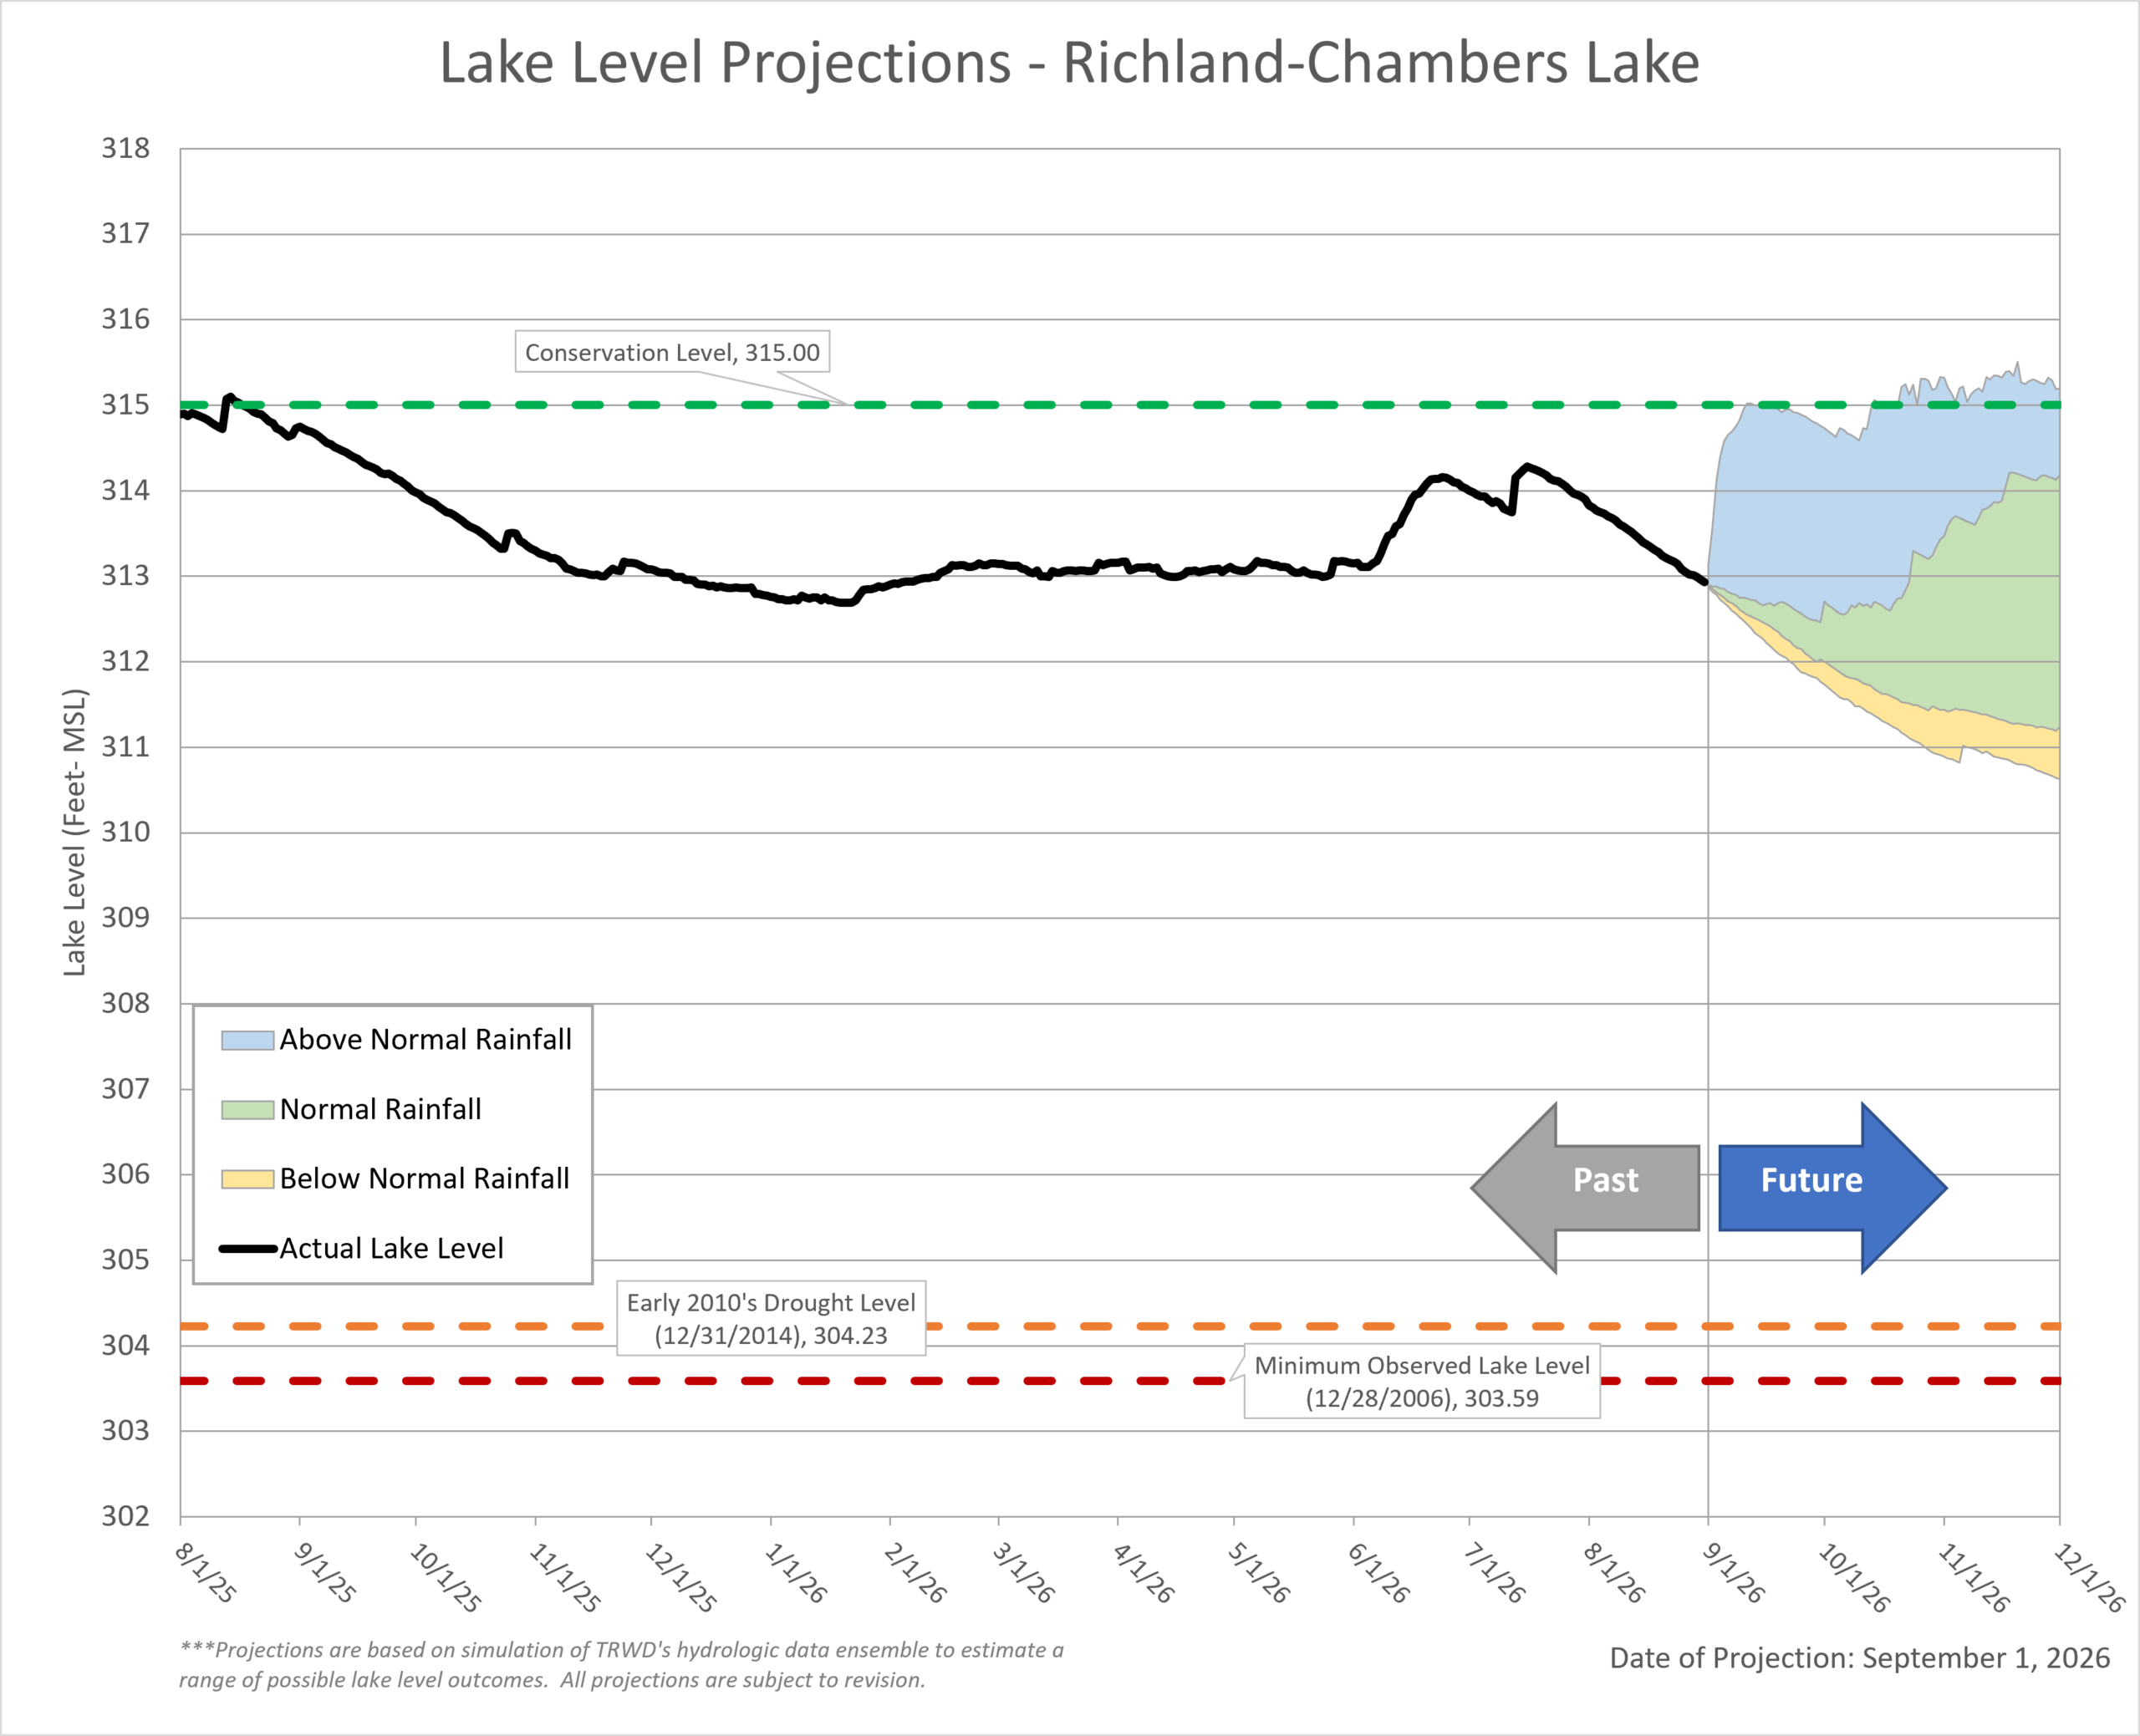 Last Month’s Projection | Historical Lake Levels
Disclaimer: These projections are based on typical operating conditions and expected weather patterns. Actual water use and weather can vary, so observed lake levels may occasionally be slightly higher or lower than the projected range.
Acknowledgments:
- Weather and Climate Insights: Special thanks to Vini de Oliveira and Craig Ottman.
- Reservoir Projections: A big thank you to Vini de Oliveira for his timely reservoir projections.
- Rainfall Analysis: Appreciation goes to Ashley Lowrie for her thorough analysis of observed rainfall.
- Editorial Review: Thank you to Olivia Whittaker for her thoughtful review and contributions to the post.