Rachel Ickert’s phone rang at about 4 a.m. in October 2015. The information was chilling.
“I remember getting the call early in the morning – I was awakened by someone there – who said it is still raining and the reservoir is coming up fast and we need to make some decisions fast,” said Ickert, water resources engineering director for the Tarrant Regional Water District.
The guy on the phone thought a hurricane had hit Richland-Chambers Reservoir. A storm in the lake’s watershed was filling up the lake – and fast. The dark clouds they had been watching were inundating the area and eventually would dump over 20 inches of rain in 48 hours.
Ickert and her District engineering flood team went into action. They stayed on the phone with the men standing on the rumbling reservoir spillway, constantly figuring out how many gates to open – and by how much – to minimize flooding. By mid-day, things began to calm down.
It was one of the first big tests for the District’s engineering flood team, and it certainly wouldn’t be the last. The group of 20 engineers, hydrologist, and data scientist keep their eyes on the sky, ready to work around the clock to protect property owners from a flood’s aftermath.
“We can’t control the weather, but we can control how we respond,” Ickert said.
There’s always been a team at the District that watched weather patterns to prepare for rainfall events that could create flooding. But in 2015 the process was formalized with the adoption of a new, two-inch thick Flood Operations Manual and the creation of a distinct flood control team.
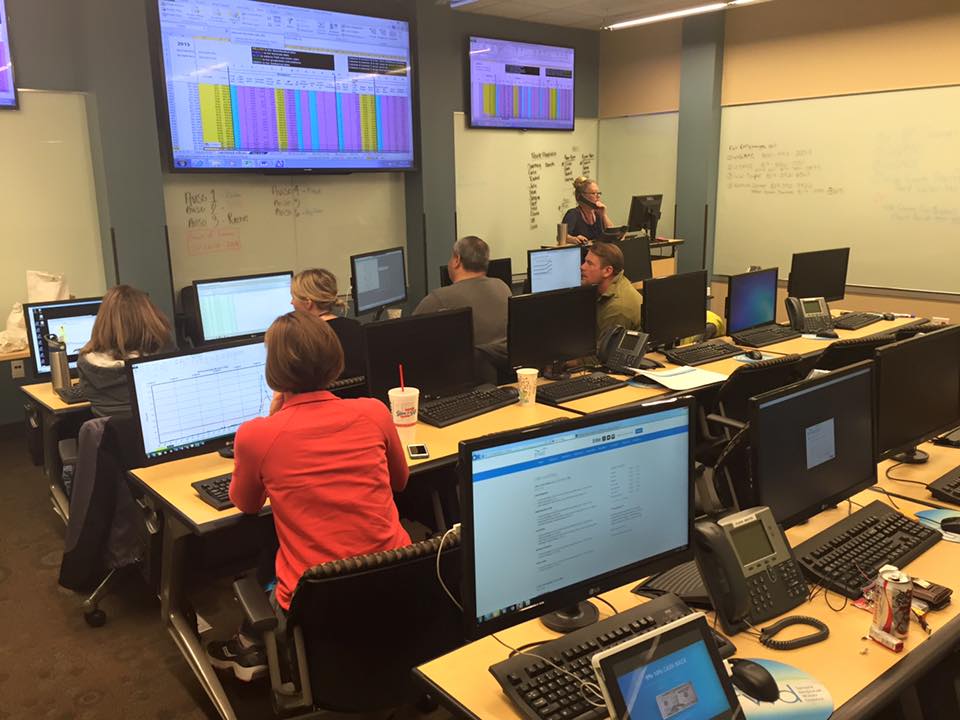
During significant rainfall events, the team works out of the District’s training room in the Henderson Building. There they are surrounded by big screens that allow them to keep track of the reports being called in from the field along with data from the National Weather Service, the National Oceanic and Atmospheric Administration and the West Gulf River Forecast Center.
Using that data the team will swing into low, medium or high alert, depending on the level of water already being stored in the District’s reservoirs and how high water levels may reach in creeks and streams according to the forecast.
The District’s meteorologist Courtney Jalbert, much like TV weathermen, makes a forecast but with additional information. She, and other flood team members, use specialized computer models that use data from stream and river gauges to predict what impact the rainfall will have, once it hits the ground. The District decides when to open reservoir gates based on the data and water on the ground and doesn’t pre-release water based on a rainfall forecast.
“When she tells me she’s nervous, it makes me nervous,” Ickert said. “I can’t think of a time she wasn’t right.”
(Jalbert, who does a bi-weekly forecast, laughed when told about Ickert’s faith in her forecasts. “Let’s just say I deliver the bad news when I have to and the good news when it’s clearing up.”)
A glimpse inside the TRWD Flood Room. As a newer communication tool, the group also updates a lake level blog with discharge information when then team is activated. Subscribe to the blog by clicking the photo.
Depending on the situation, the team will be broken down into groups of six; the hydrologist, engineers, data scientist and field workers will all work three, eight-hour shifts if it’s a significant event. They keep the public informed through the popular Lake Level Blog and Flood Hotline, which receive tens of thousands of page views during wetter months.
The first priority of the team is public safety. They want to protect the integrity of the dams while minimizing the flooding of roads that would be used by emergency personnel. They also try to lessen property damage downstream of the reservoirs if at all possible. It’s a delicate balance.
“If the water level rises to cover a roadway, we can’t always control that, but we try not to exacerbate the situation,” Ickert said. “We do the best we can with what we have, but sometimes Mother Nature hands you more than you can handle”
The Oct. 24, 2015 storm in Corsicana is a memorable example of the team in action.
Chris Zachry remembers making that jarring wake-up call to Ickert. He had been operating the gates at Richland Chambers and said rain was coming down so hard “it was like a hurricane.”
“It was a pretty intense situation and it kept raining,” said Zachry, who is the nearby wetlands project manager. “I called her about 4 a.m. and said, ‘This is big.’”
Ickert got Jalbert and other members of the flood control team on the phone. Only one year into her job as water resources director, Ickert called in as mentors Dave Marshall, director of engineering and operations support, and Alan Thomas, deputy general manager.
During the October 2015 storm, the TRWD flood team discharged enough water to fill Lake Bridgeport and 90 percent of Eagle Mountain Lake.
This was the largest storm to ever have occurred in the Richland Chambers watershed.
The team started running spreadsheet calculations to determine how much water to release and how fast. Midway through the event, the lake level gauge maxed out and quit working.
At that point, visual elevation readings from the reservoir had to be called in to the engineering team every 15 minutes. Zachry and Lonnie “Bubba” Byers, the resident lake superintendent, stood on the spillway and watched as they eventually opened all 24 gates.
“You could see the whirlpools when we opened the gates and you could hear the slurping at both ends of the dam. You could feel it in your body,” Zachry said.
Eventually the storm, which had a one-in-1000-chance of occurring in a given year, pushed the district to make its biggest release in history, just over 140,000 cubic feet per second at its peak. At this rate, AT&T Stadium, home of the Dallas Cowboys, would fill with water in about 12 minutes.
“It was an amazing event. It was nothing we couldn’t handle, but it was bigger than we’d ever seen,” Zachry said. It took about five days to return the reservoir to its normal level. In total, the amount of water released would have filled Lake Bridgeport and 90 percent of Eagle Mountain Lake.
The District’s team has dealt with lesser storms since then, but it has been busy.
According to the National Weather Service, the five-year time period from 2015 to 2019 has been the wettest on record with 225.2 inches of rain, or an average of 45 inches a year. To put this in perspective, the normal annual rainfall for the DFW area is about 36 inches.
The same five-year time frame holds five record rainfalls in a month and 2015 was the wettest on record with 62.61 inches of rain.
As a result, the District’s four reservoirs – Bridgeport, Eagle Mountain, Richland Chambers and Cedar Creek -each have spent at least 37 months above conservation level, which means the flood team is constantly overseeing flows to prevent and lessen flooding downstream.
And the rain has kept falling in 2020. This year currently stands as the eighth wettest start of the year, recording nearly a years’ worth of rain in about half the time.
One of the storms was on Memorial Day weekend when, in addition to a tornado, nearly 8 inches of rain fell in the Bowie area. The rain gauge at nearby Lake Amon G. Carter recorded 5.18 inches in an hour, which is estimated to be a 1-in-1,000 chance storm.
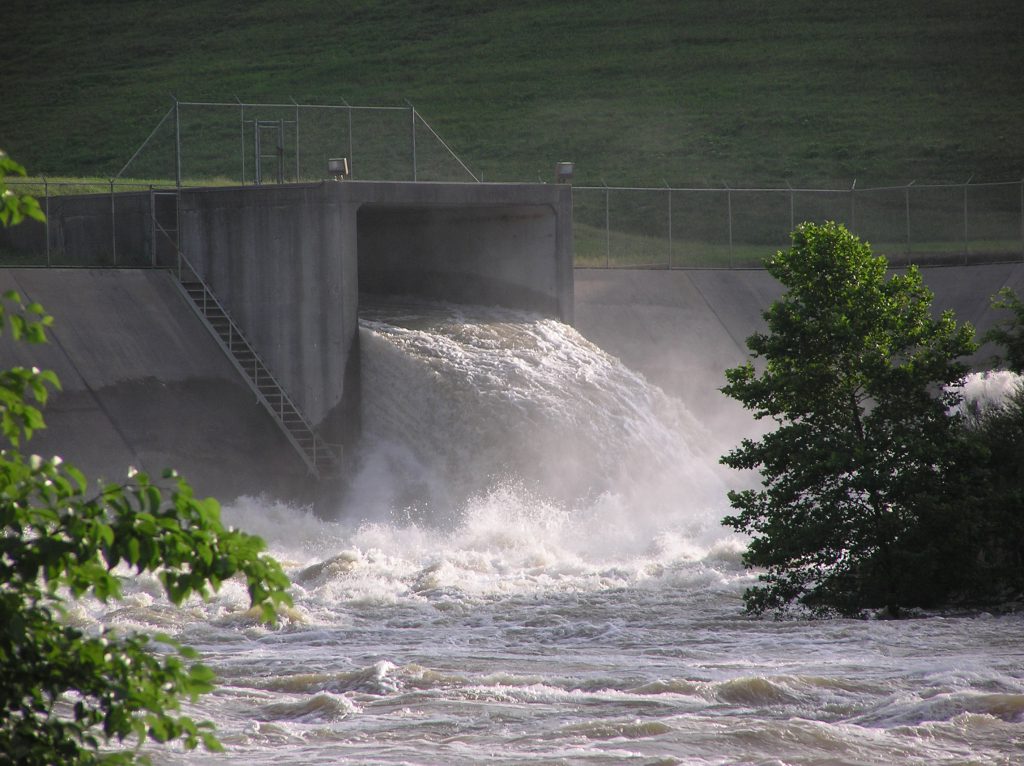
The district managed the water flowing from Lake Bridgeport and its watershed as it came toward Fort Worth.
By the time the water hit the Trinity River here, no one noticed.
WATCH: Water discharged from Lake Bridgeport during the 2015 floods