(previously posted on Jan 12, 2016)
Innovation was at the forefront when TRWD’s Geospatial Services Department was searching for a new way to collect and map data, specifically for the Integrated Pipeline Project (IPL).
“We were looking for a way to improve how we do business, and improve the way we support personnel who manage the pipeline,” said Jeff Coffey, geospatial services department manager.
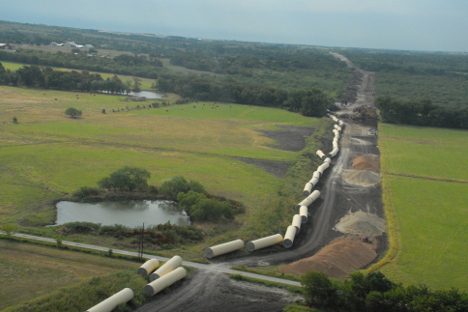
“Think about it. Once a pipeline is buried, it becomes difficult to find. And the only time we will ever need to get back to that pipe is if something goes wrong. And if something does go wrong, we have to find exactly where that problem is.”
For the past several decades, mapping sections of pipe was a difficult and convoluted process. Coffey said his department would be given boxes of documents at the end of a project that had to be entered into several databases.
It took 5 years to input 20-miles of data from the Eagle Mountain pipeline. It’s a lot of work,” he said.
This time with the IPL project there are more than 100 miles to be mapped. And the longer it takes to get the data into the system and back out to the crews, the more it’s costing TRWD in terms of effectively and efficiently managing the system.
Coffey said the district has been marching toward a goal of being able to find a section of pipe with precision and get it mapped in real-time.
“Our initial accuracy goal was less than a bucket width of a backhoe. We also knew we wanted a collection method that would allow data to be inputted directly from personnel on the construction site,” he said. “Before the documentation process stopped at engineering laysheets. We wanted to take it a step further.”
As advances in technology began to merge with cost-effective equipment and accessibility, Coffey said these goals were within reach.
“About 2 years ago, the technology and cost of equipment were close enough together to see their eventual intersection,” he said. “We just took a rope and grappling hook and pulled them in together to meet sooner. We made that connection. We made that happen. It was a perfect storm.”
Coffey said the accuracy goal has gone from about 5 feet down to just centimeters.
“We figured out a way to input data with sub-decimeter accuracy straight into a GIS database. That’s what the real-time as-built is,” he said. “We have cross-trained pipe inspectors to utilize sub-centimeter GPS units and collect features as the pipes go into the ground. Now part of their pipe inspector duties is not only figuring out whether that wrap is done correctly or if the pipe has been nicked, but also has the pipe been situated in the ground properly in terms of the X, Y and Z coordinates.”