July brought typical summer weather across North Texas, with rainfall varying across the region and lower reservoir inflows than earlier in the season. While high temperatures, evaporation, and seasonal water demands continued to put pressure on lake levels, above-normal rainfall in the East Texas watersheds helped offset some of those impacts. As a result, storage at Cedar Creek and Richland-Chambers increased, helping limit the overall system storage decline to just 2% during the month. System storage remained relatively stable, ending July at approximately 89% capacity and in a favorable position as we move through the peak of summer.
As we enter August, hot temperatures and high evaporation rates are expected to continue, which may contribute to gradual seasonal declines in lake levels. Water demands typically peak around mid-August before beginning their seasonal decline toward the mid-January low. Although summer heat and evaporation may continue to affect reservoir storage in the near term, declining water demands should help ease some of that pressure as we move into the fall. Current storage conditions continue to support a reliable water supply, and TRWD will closely monitor lake levels and watershed conditions throughout the remainder of the summer.
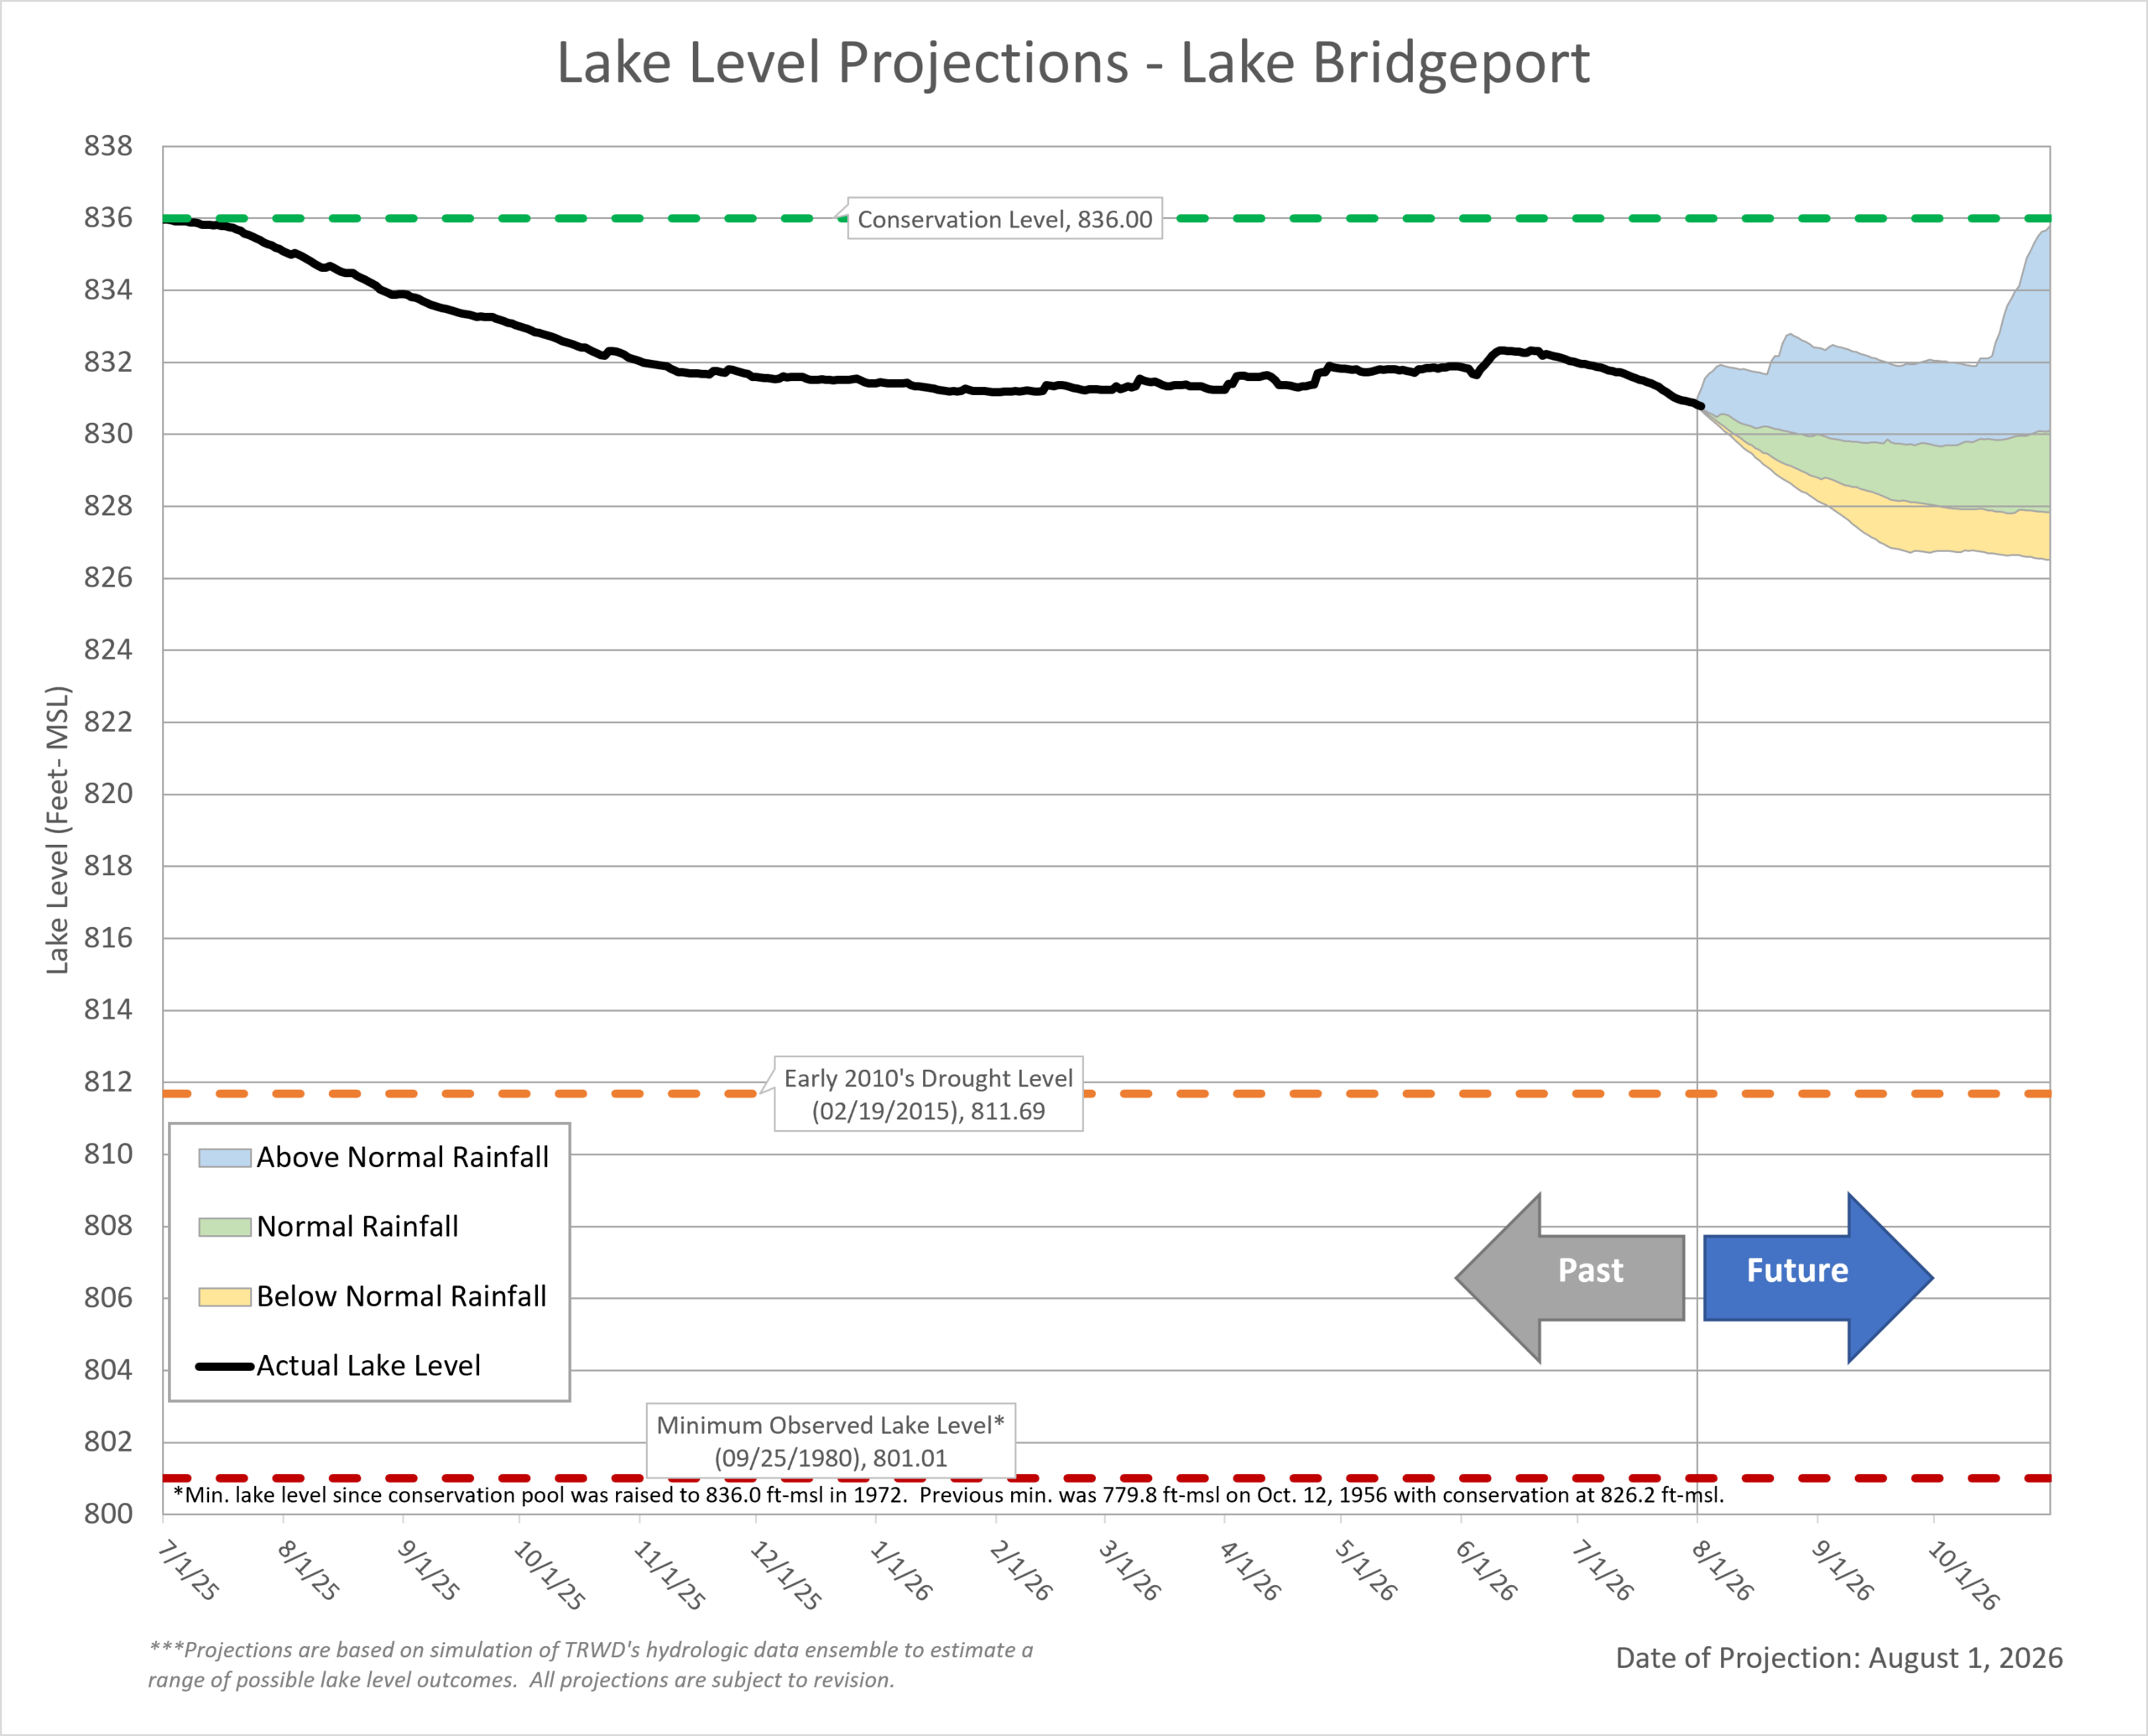
What to Expect: Based on current conditions, lake levels are expected to generally follow the “Normal Rainfall” or “Below Normal” trends represented by the green and yellow shaded areas on the Lake Level Projection Plots. Actual conditions may vary throughout the month, but lake levels would likely only move above those projected trends if the watersheds receive above-average rainfall.
July Highlights:
- Temperature: July was warmer than normal, with average temperatures at DFW reaching 85.7°F, approximately 2.6° F above normal.
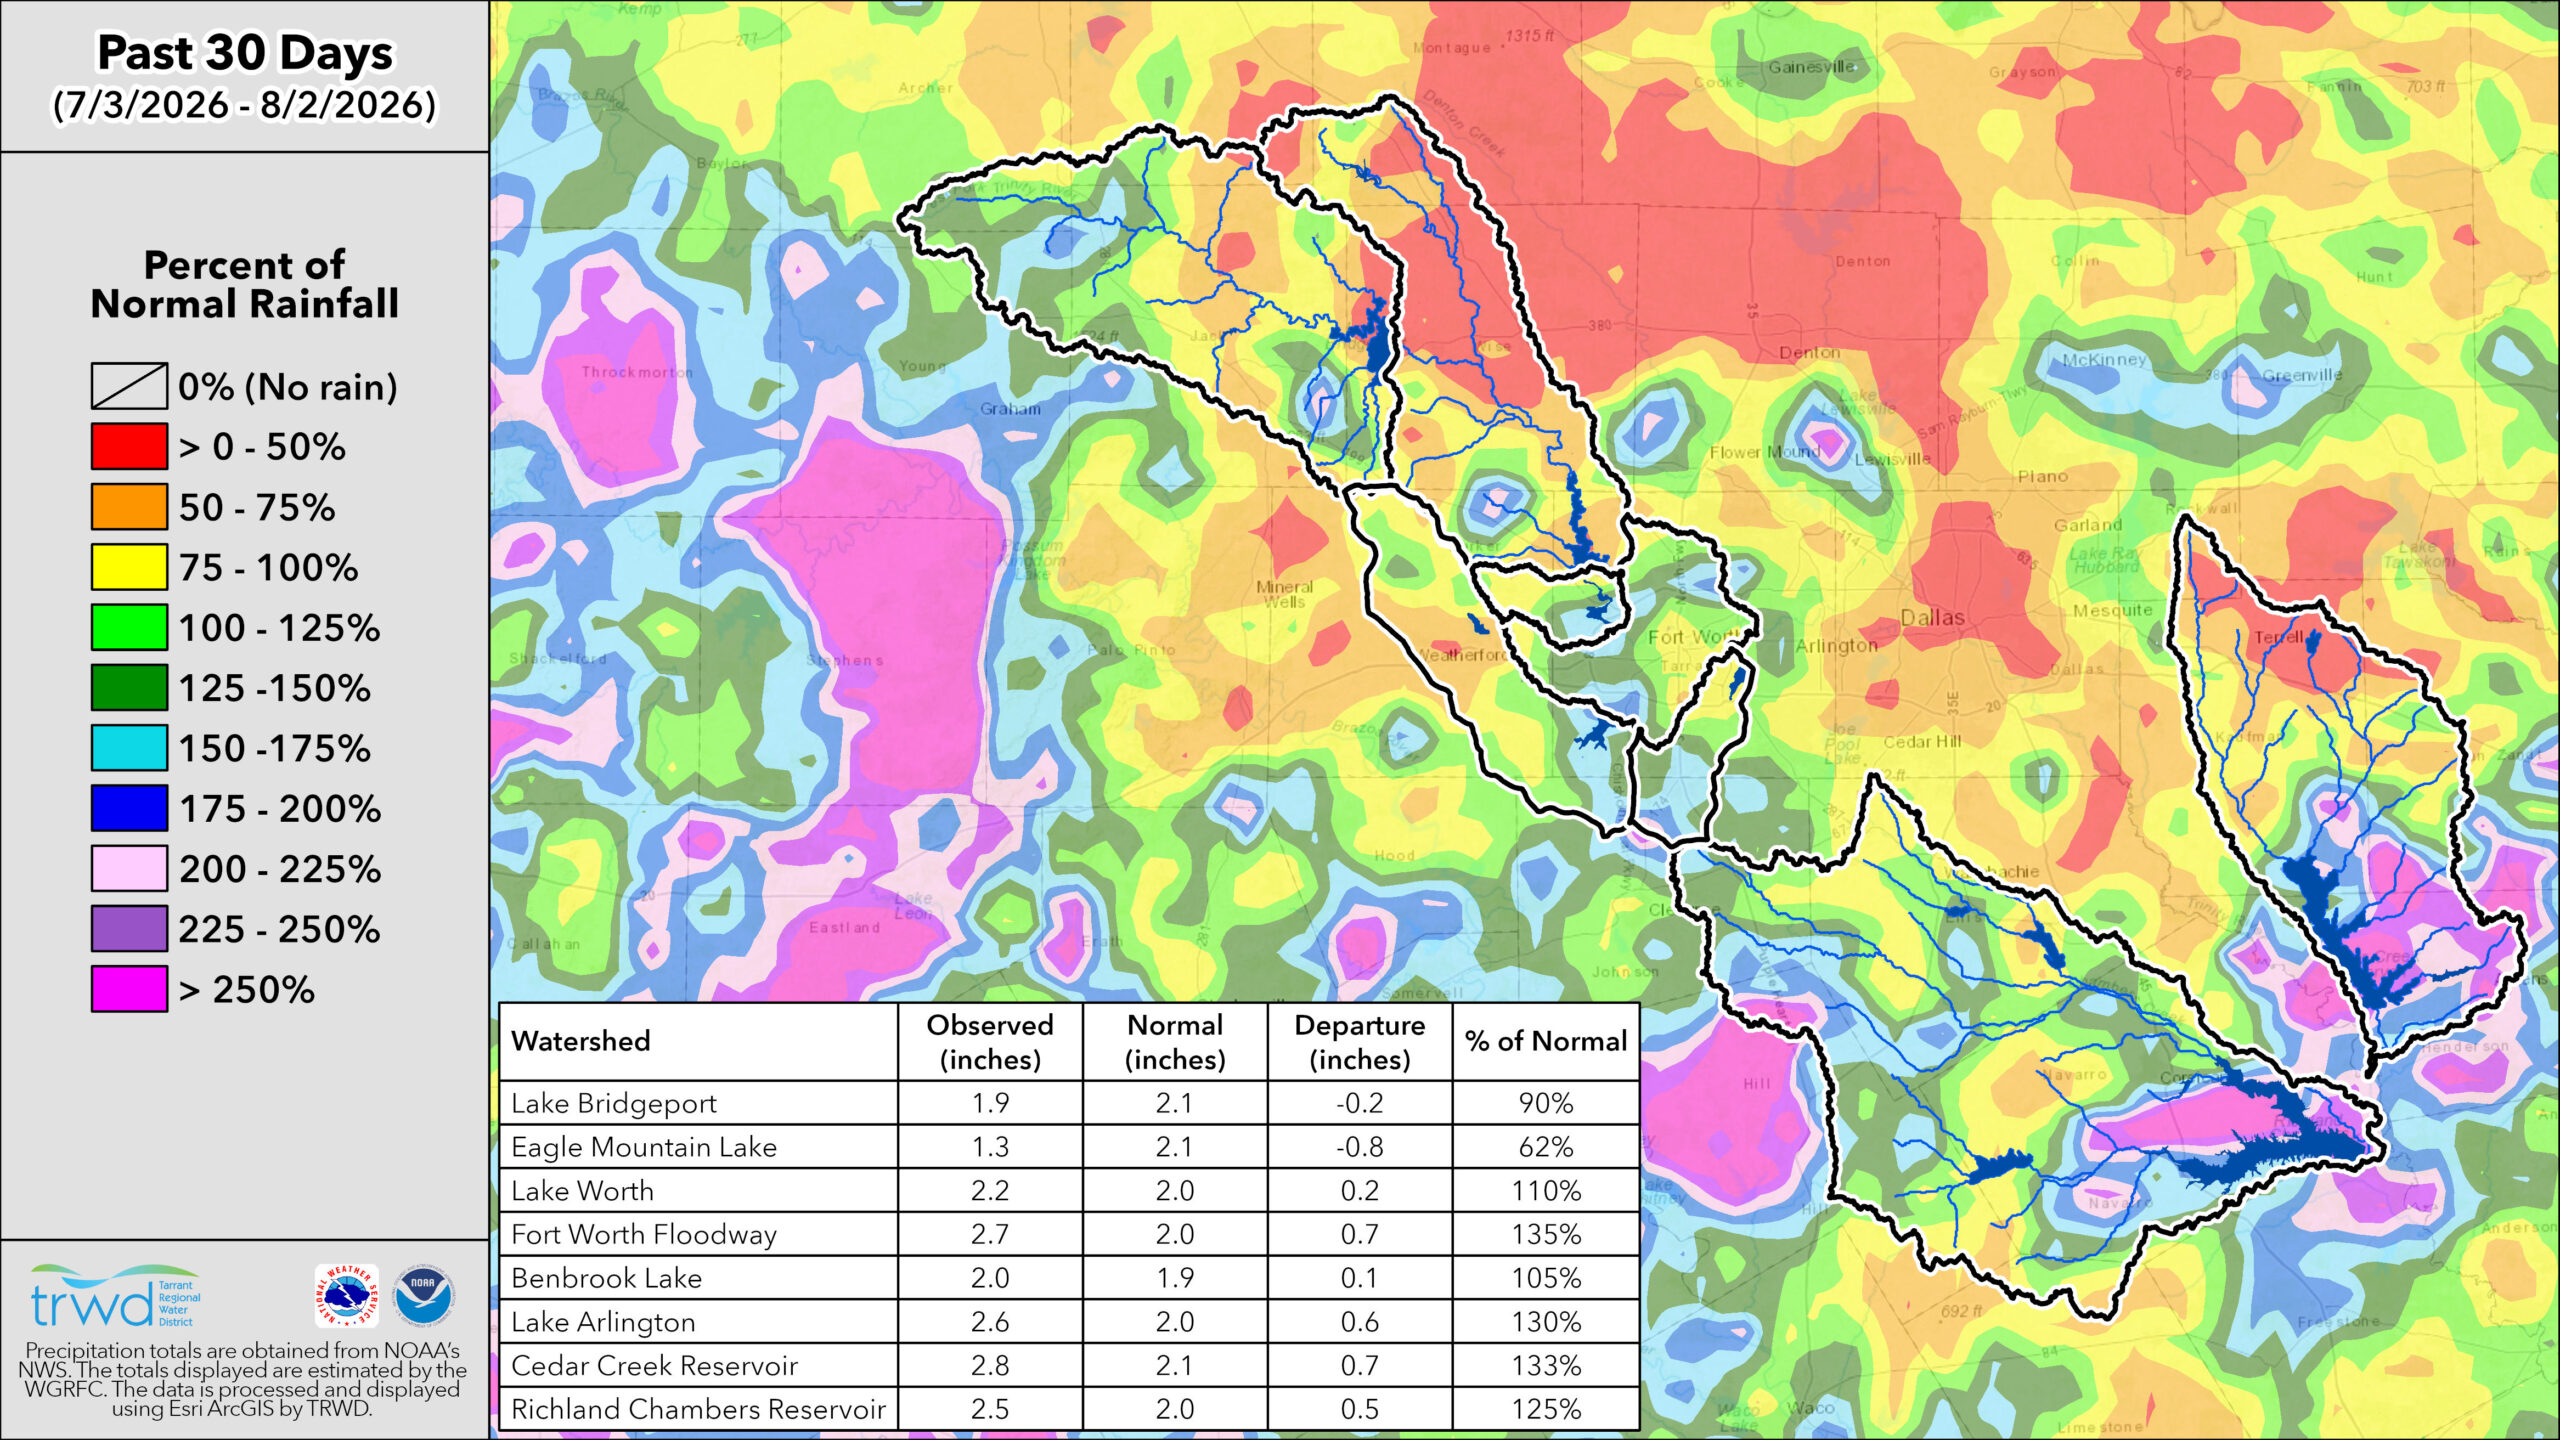
- Rainfall: All TRWD watersheds except Eagle Mountain recorded near- or above-normal rainfall during July, as shown in the rainfall map below. While the rainfall did not generate enough runoff to fully offset water losses from evaporation and water demand rates, above-normal rainfall in the East Texas watersheds helped slow the overall storage decline.
- Drought:
- The rainfall events in July, particularly early in the month, left most of North Texas and the TRWD service area free of drought.
- View the latest conditions on the NWS Drought Monitor.
Looking Ahead:
- ENSO Conditions: El Niño conditions are present and are expected to continue strengthening into the Northern Hemisphere winter.
- Rainfall: Below normal precipitation totals are expected for August. Longer‑range outlooks also indicate below-normal precipitation through the remainder of the summer and into early fall.
- Temperatures: Above-normal temperatures are expected through the end of the summer.
- Looking Further: El Niño is expected to continue strengthening through the end of the year, with a 97% chance of persisting into early spring 2027. As a result, North and Central Texas may see increased rainfall chances this fall. Local guidance currently shows a slight preference for above-normal fall precipitation, but outcomes can vary depending on other weather patterns. Recent strong El Niño years, including 2015 and 2023, have included notably wet fall periods in the DFW area.
*Note: ENSO, or the El Niño-Southern Oscillation, is a recurring climate pattern that influences global weather. It has two main phases: El Niño, which often brings wetter conditions, and La Niña, which typically leads to drier and warmer weather in Texas, especially during fall and winter. This shift is important for water resource planning, as it can affect rainfall and reservoir levels.
Stay Informed by Checking Out the Following:
- TRWD’s quarterly watershed protection newsletter, The Tributary.
- The latest Lake Level Projections (see below).
- Links to historical lake level plots.
- Past projections compared to actual outcomes.
Thank you for following the Lake Level Blog. Check back next month for more updates!
TRWD Watershed Rainfall
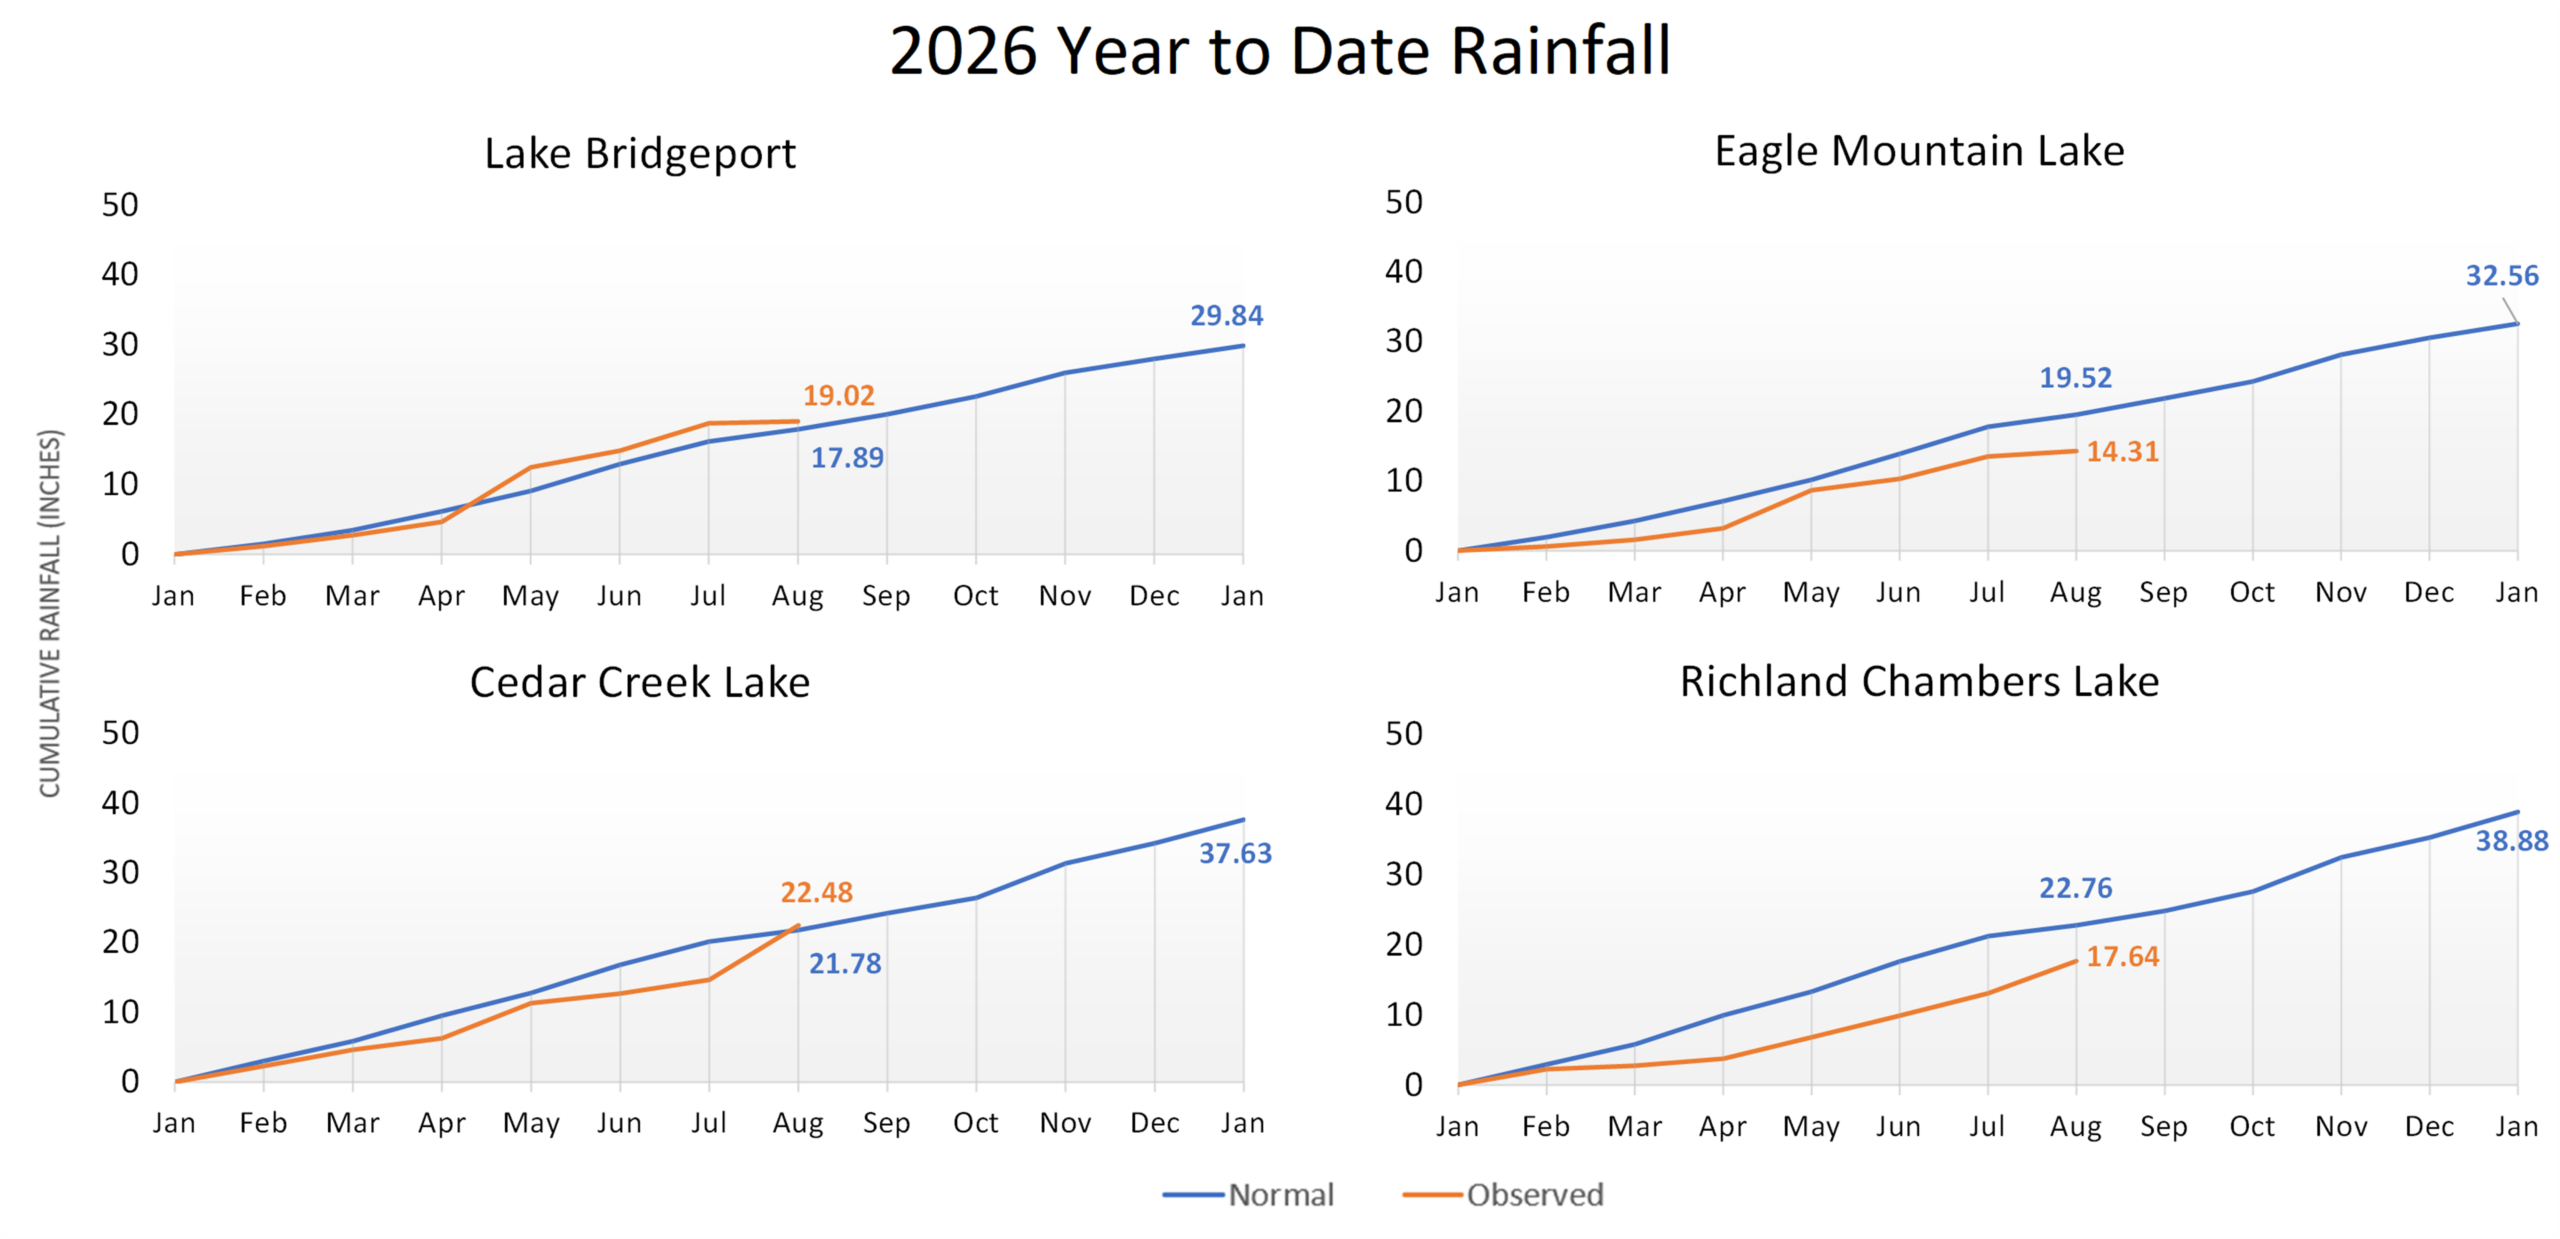
TRWD Lake Rainfall Totals through August 3, 2026
Lake Level Projections
Note: Lake level projections are based on expected climate conditions, water use demands, and planned operations, including releases and pumping. Actual lake levels may vary based on observed weather, actual water use, and operational responses to changing conditions.
 Last Month’s Projection | Historical Lake Levels
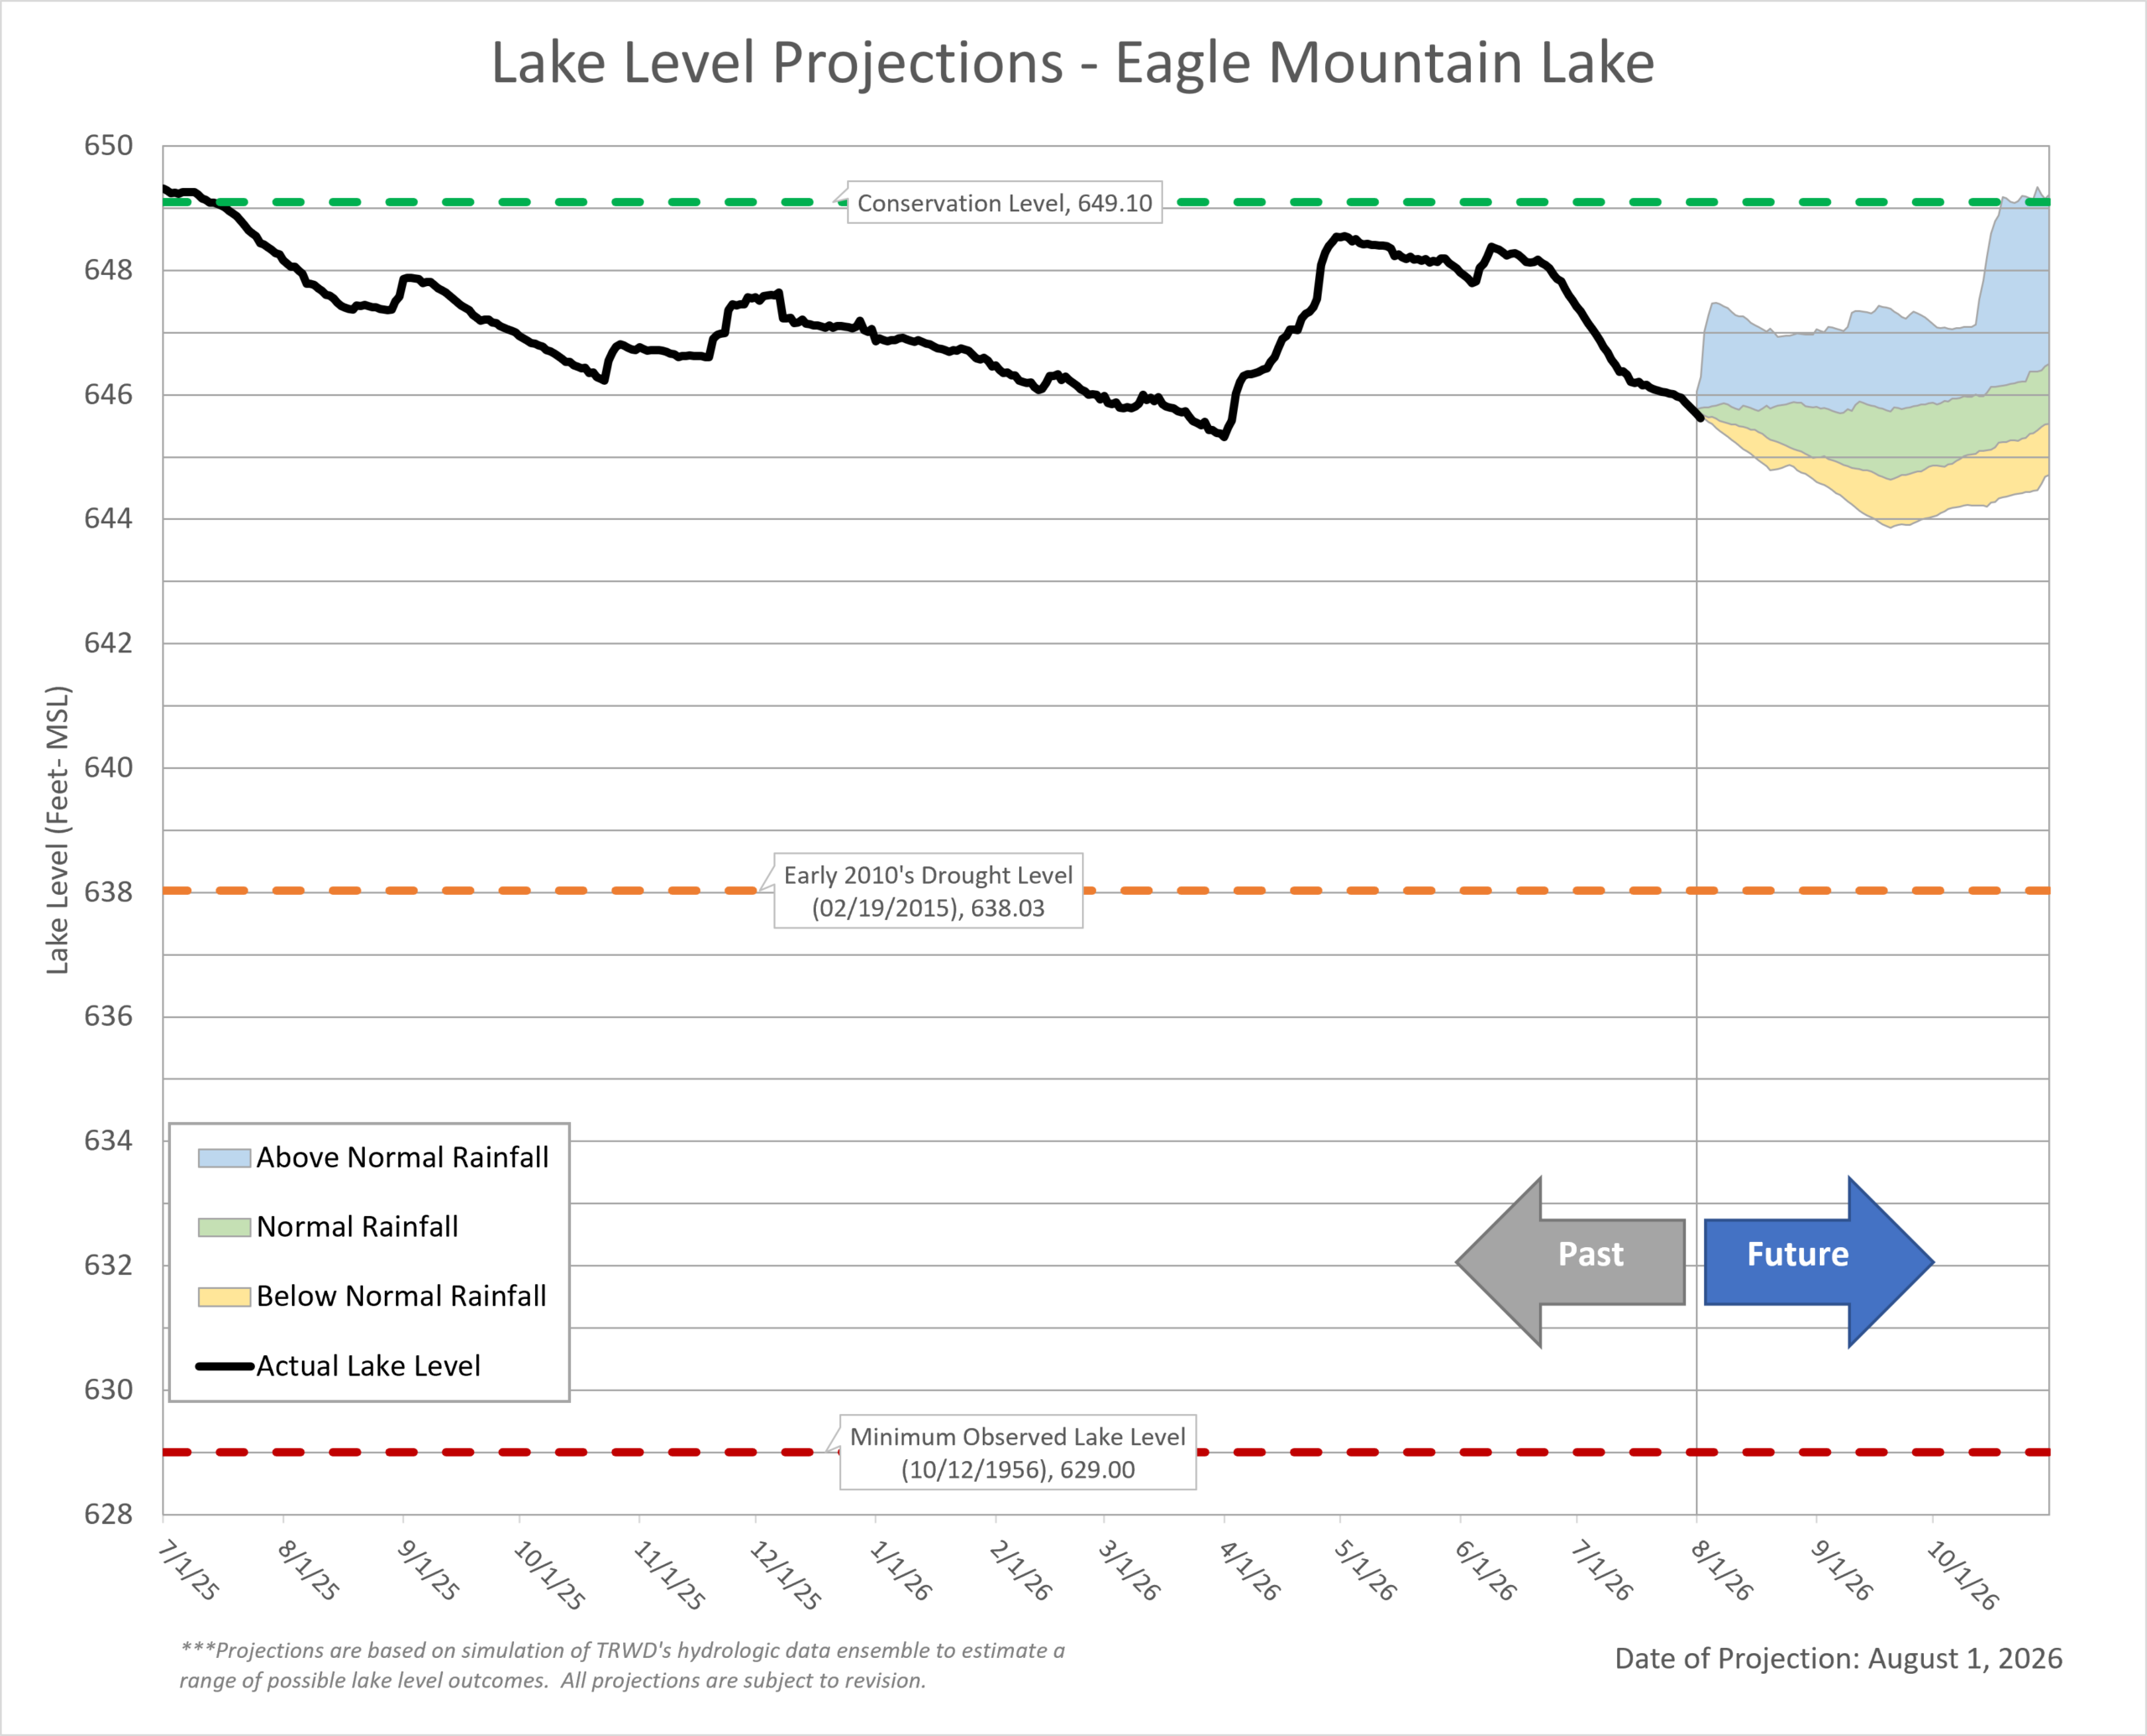 Last Month’s Projections | Historical Lake Levels
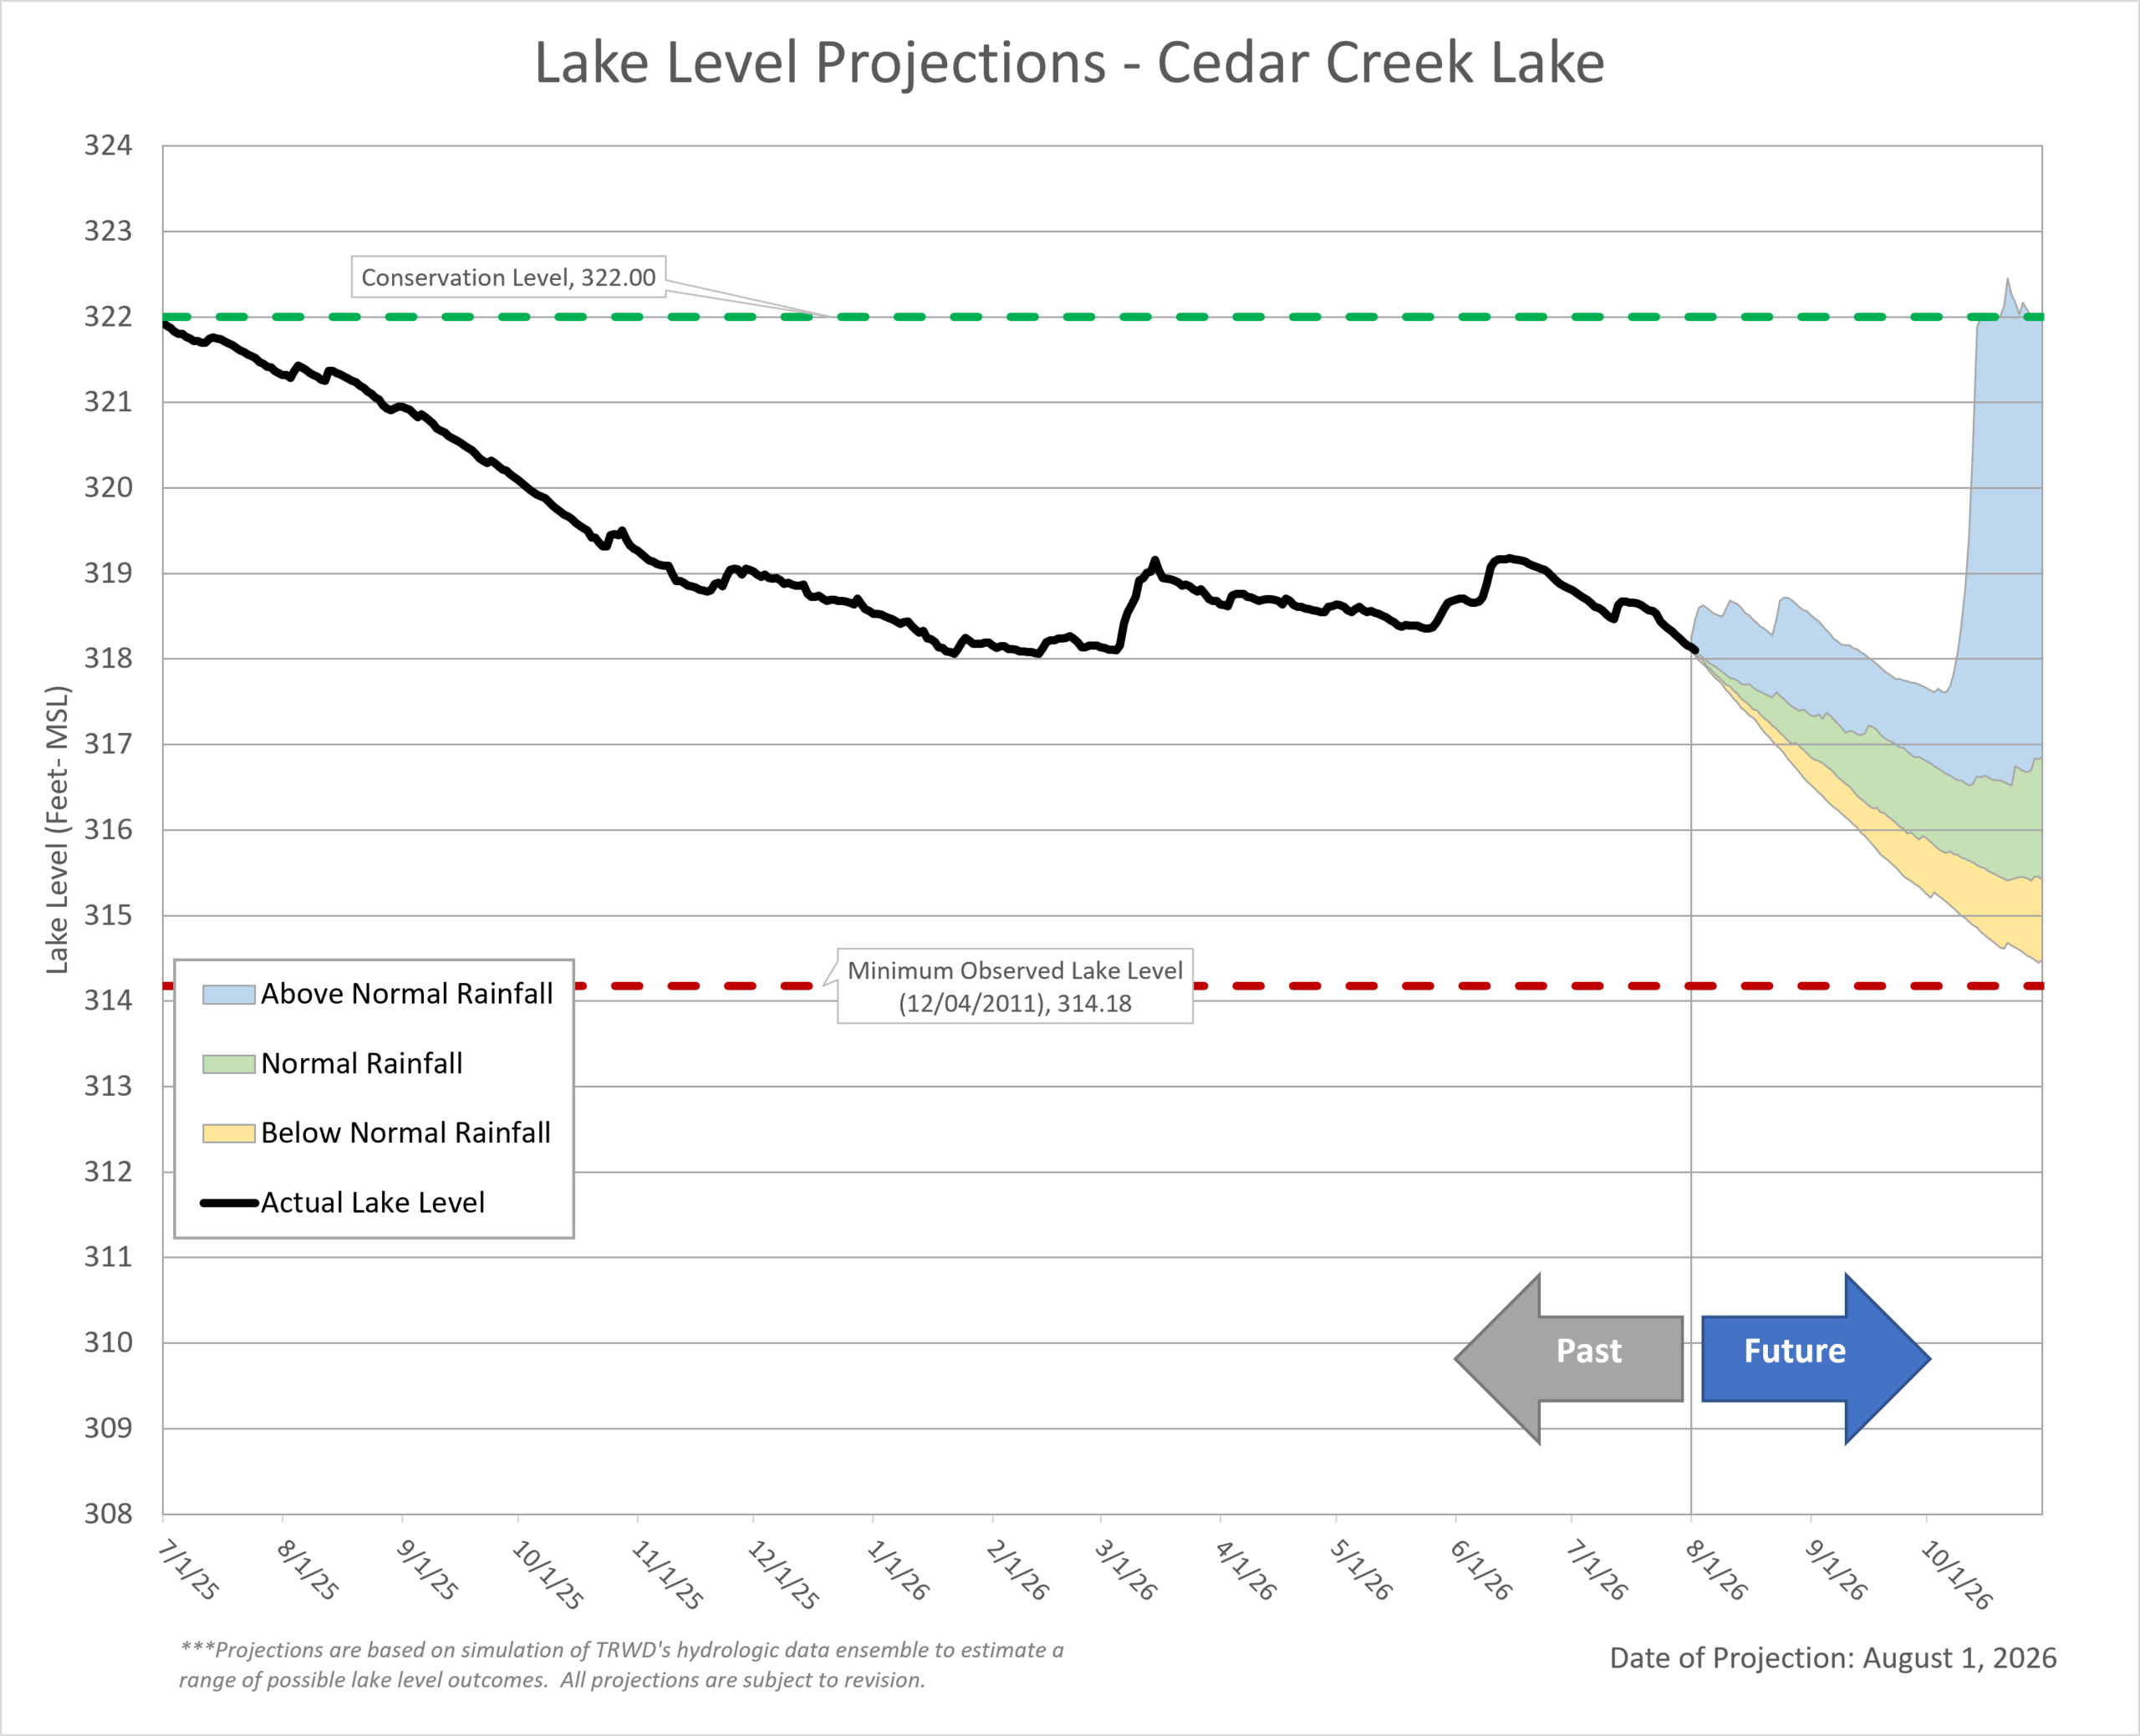 Last Month’s Projection | Historical Lake Levels
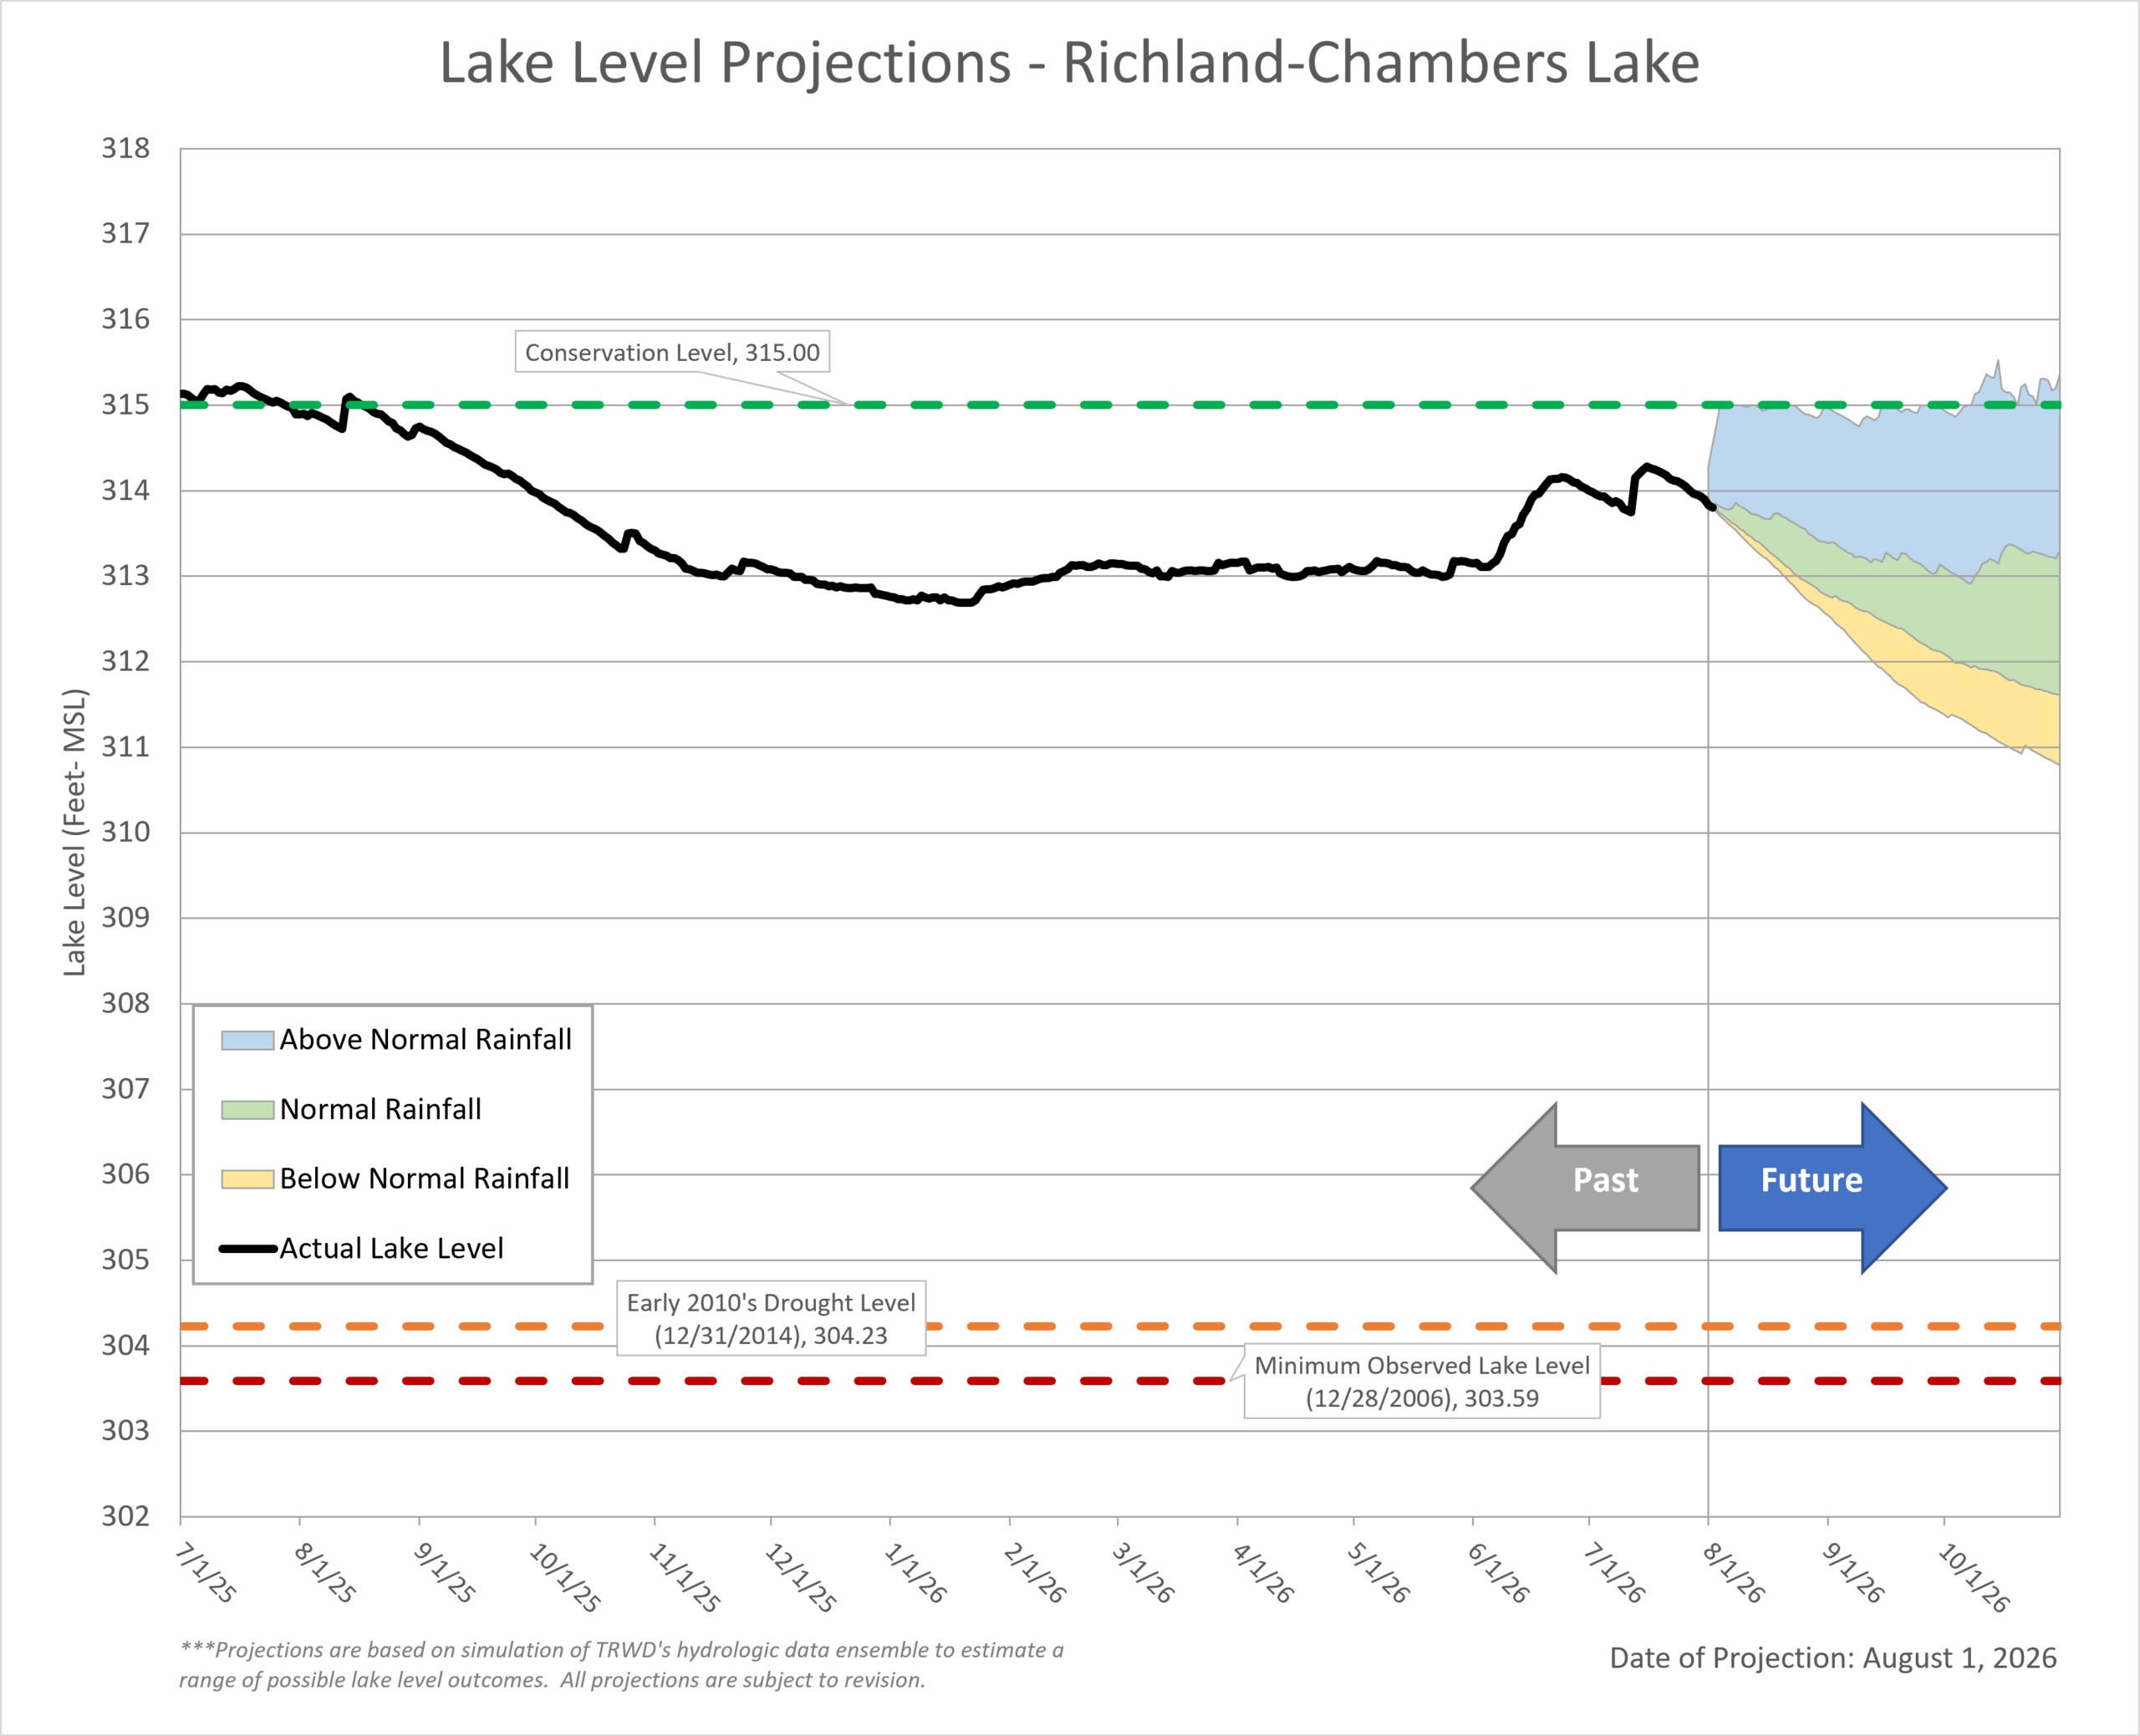 Last Month’s Projection | Historical Lake Levels
Disclaimer: These projections are based on typical operating conditions and expected weather patterns. Actual water use and weather can vary, so observed lake levels may occasionally be slightly higher or lower than the projected range.
Acknowledgments:
- Weather and Climate Insights: Special thanks to Vini de Oliveira and Craig Ottman.
- Reservoir Projections: A big thank you to Vini de Oliveira for his timely reservoir projections.
- Rainfall Analysis: Appreciation goes to Ashley Lowrie for her thorough analysis of observed rainfall.
- Editorial Review: Thank you to Olivia Whittaker for her thoughtful review and contributions the post.